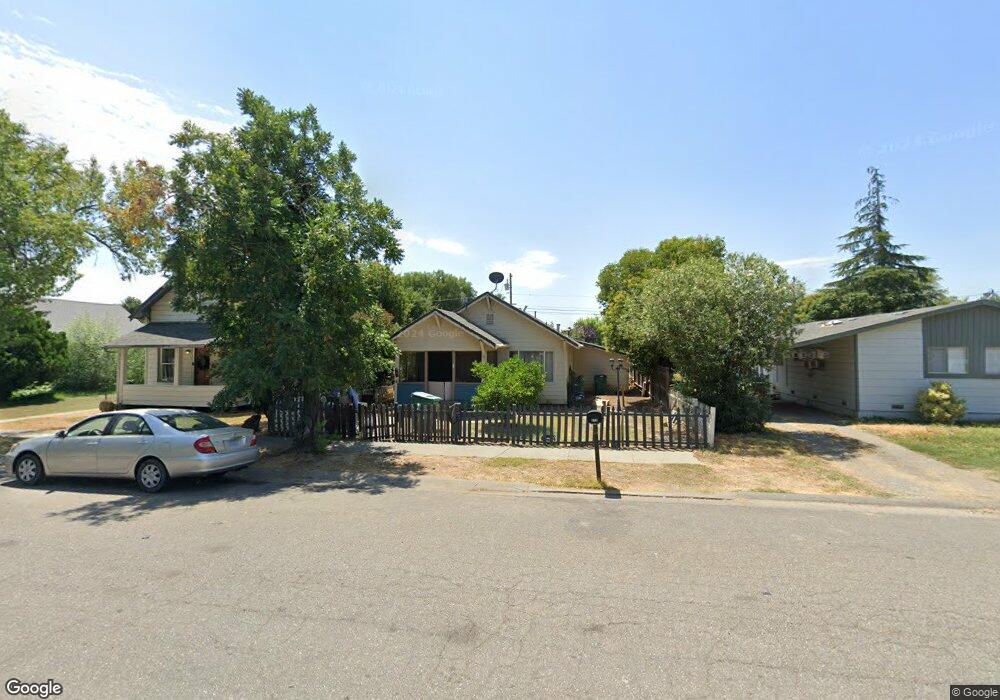
619 Walnut St Corning, CA 96021
Estimated Value: $165,315 - $241,000
1
Bed
1
Bath
771
Sq Ft
$253/Sq Ft
Est. Value
About This Home
This home is located at 619 Walnut St, Corning, CA 96021 and is currently estimated at $195,329, approximately $253 per square foot. 619 Walnut St is a home located in Tehama County with nearby schools including Olive View Elementary School, Maywood Middle School, and Corning High School.
Ownership History
Date
Name
Owned For
Owner Type
Purchase Details
Closed on
Aug 29, 2011
Sold by
Citimortgage Inc
Bought by
Dejesus Bertin Flores
Current Estimated Value
Purchase Details
Closed on
May 12, 2011
Sold by
Talley John F and Talley Elizabeth
Bought by
Citimortgage Inc
Purchase Details
Closed on
Dec 8, 2003
Sold by
Talley John F
Bought by
Talley John F
Home Financials for this Owner
Home Financials are based on the most recent Mortgage that was taken out on this home.
Original Mortgage
$69,600
Interest Rate
7.99%
Mortgage Type
New Conventional
Create a Home Valuation Report for This Property
The Home Valuation Report is an in-depth analysis detailing your home's value as well as a comparison with similar homes in the area
Purchase History
| Date | Buyer | Sale Price | Title Company |
|---|---|---|---|
| Dejesus Bertin Flores | $43,000 | Northern California Title Co | |
| Citimortgage Inc | $24,295 | Pasion Title | |
| Talley John F | -- | Fidelity National Title |
Source: Public Records
Mortgage History
| Date | Status | Borrower | Loan Amount |
|---|---|---|---|
| Previous Owner | Talley John F | $69,600 |
Source: Public Records
Tax History
| Year | Tax Paid | Tax Assessment Tax Assessment Total Assessment is a certain percentage of the fair market value that is determined by local assessors to be the total taxable value of land and additions on the property. | Land | Improvement |
|---|---|---|---|---|
| 2025 | $562 | $53,996 | $25,114 | $28,882 |
| 2023 | $552 | $51,901 | $24,140 | $27,761 |
| 2022 | $544 | $50,884 | $23,667 | $27,217 |
| 2021 | $524 | $49,887 | $23,203 | $26,684 |
| 2020 | $530 | $49,377 | $22,966 | $26,411 |
| 2019 | $508 | $48,410 | $22,516 | $25,894 |
| 2018 | $509 | $47,462 | $22,075 | $25,387 |
| 2017 | $506 | $46,533 | $21,643 | $24,890 |
| 2016 | $472 | $45,621 | $21,219 | $24,402 |
| 2015 | -- | $44,937 | $20,901 | $24,036 |
| 2014 | $461 | $44,058 | $20,492 | $23,566 |
Source: Public Records
Map
Nearby Homes
- 1117 Peach St
- 615 Walnut St
- 609 Walnut St
- 5655 Walnut St
- 0 Walnut St Unit 7 200600310
- 0 Walnut St
- 620 Chestnut St
- 1171 Peach St
- 612 Chestnut St
- 603 Walnut St
- 703 Walnut St
- 1114 Pear St
- 608 Chestnut St
- 1112 Peach St
- 1118 Peach St
- 706 Walnut St Unit 4
- 706 Walnut St
- 711 Walnut St
- 1020 Peach St
- 523 Walnut St
Your Personal Tour Guide
Ask me questions while you tour the home.