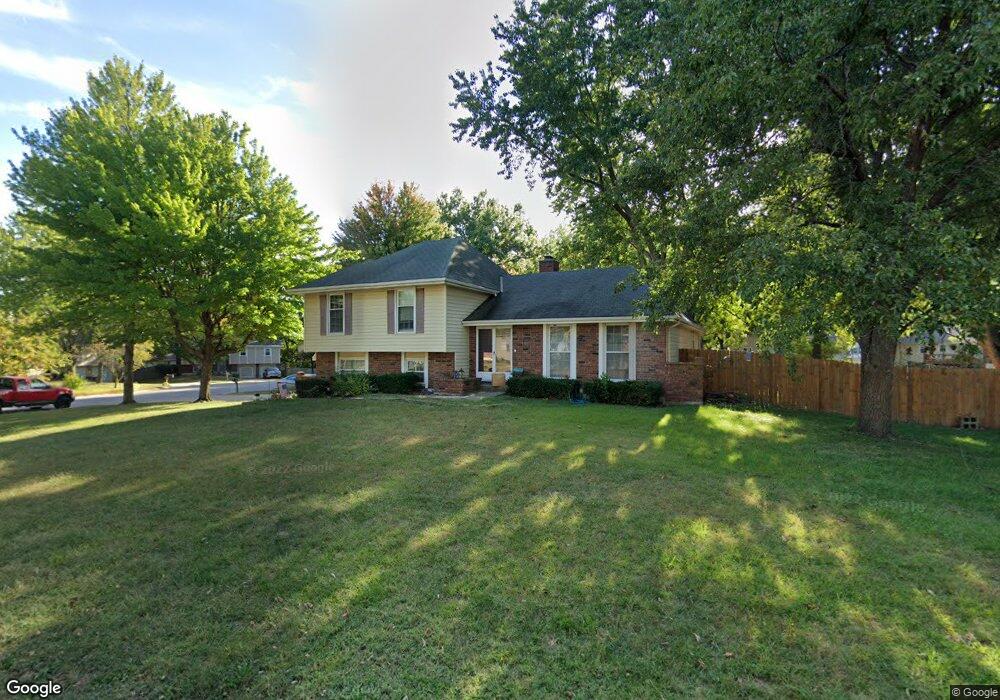
6208 Albervan St Shawnee, KS 66216
Estimated Value: $355,000 - $376,000
3
Beds
3
Baths
1,504
Sq Ft
$242/Sq Ft
Est. Value
About This Home
This home is located at 6208 Albervan St, Shawnee, KS 66216 and is currently estimated at $364,050, approximately $242 per square foot. 6208 Albervan St is a home located in Johnson County with nearby schools including Broken Arrow Elementary School, Trailridge Middle School, and Shawnee Mission Northwest High School.
Ownership History
Date
Name
Owned For
Owner Type
Purchase Details
Closed on
Oct 18, 2016
Sold by
Remigio Jesse J
Bought by
Remigio Jessica M
Current Estimated Value
Purchase Details
Closed on
May 9, 2005
Sold by
Huddleston Brian P and Huddleston Jennifer W
Bought by
Remigio Jesse J and Remigio Jessica M
Home Financials for this Owner
Home Financials are based on the most recent Mortgage that was taken out on this home.
Original Mortgage
$171,478
Outstanding Balance
$89,352
Interest Rate
5.83%
Mortgage Type
VA
Estimated Equity
$274,698
Purchase Details
Closed on
Jan 30, 2001
Sold by
Rogers Alice M and Rogers Thomas J
Bought by
Huddleston Brian P and Huddleston Jennifer W
Home Financials for this Owner
Home Financials are based on the most recent Mortgage that was taken out on this home.
Original Mortgage
$116,800
Interest Rate
7.21%
Create a Home Valuation Report for This Property
The Home Valuation Report is an in-depth analysis detailing your home's value as well as a comparison with similar homes in the area
Home Values in the Area
Average Home Value in this Area
Purchase History
| Date | Buyer | Sale Price | Title Company |
|---|---|---|---|
| Remigio Jessica M | -- | None Available | |
| Remigio Jesse J | -- | Cbkc Title & Escrow Llc | |
| Huddleston Brian P | -- | Chicago Title Insurance Co |
Source: Public Records
Mortgage History
| Date | Status | Borrower | Loan Amount |
|---|---|---|---|
| Open | Remigio Jesse J | $171,478 | |
| Previous Owner | Huddleston Brian P | $116,800 |
Source: Public Records
Tax History Compared to Growth
Tax History
| Year | Tax Paid | Tax Assessment Tax Assessment Total Assessment is a certain percentage of the fair market value that is determined by local assessors to be the total taxable value of land and additions on the property. | Land | Improvement |
|---|---|---|---|---|
| 2024 | $4,551 | $36,318 | $6,544 | $29,774 |
| 2023 | $4,480 | $34,534 | $6,226 | $28,308 |
| 2022 | $4,502 | $31,648 | $5,658 | $25,990 |
| 2021 | $4,184 | $28,324 | $5,146 | $23,178 |
| 2020 | $3,581 | $25,875 | $4,677 | $21,198 |
| 2019 | $3,591 | $24,438 | $4,247 | $20,191 |
| 2018 | $3,788 | $23,380 | $4,247 | $19,133 |
| 2017 | $2,625 | $22,092 | $3,694 | $18,398 |
| 2016 | $4,149 | $20,907 | $3,694 | $17,213 |
| 2015 | $2,304 | $19,918 | $3,694 | $16,224 |
| 2013 | -- | $18,837 | $3,694 | $15,143 |
Source: Public Records
Map
Nearby Homes
- 14204 W 63rd St
- 14214 W 63rd St
- 6145 Park St
- 6143 Park St
- 14406 W 65th Terrace
- 5826 Oakview St
- 5919 Pflumm Rd
- 5713 Widmer Rd
- 5703 Cottonwood St
- 4908 Noland Rd
- 5633 Oakview St
- 6640 Pflumm Rd
- 13415 W 66th Terrace
- 5530 Rene St
- 5807 Noland Rd
- 5502 Mullen Rd
- 12914 W 67th St
- 12809 W 57th Terrace
- 5507 Noland Rd
- 6942 Constance St
- 6212 Albervan St
- 6204 Albervan St
- 6207 Albervan St
- 6211 Albervan St
- 14115 W 62nd Terrace
- 6200 Albervan St
- 6201 Albervan St
- 14114 W 62nd Terrace
- 6219 Albervan St
- 6209 Mullen Rd
- 6213 Mullen Rd
- 6205 Mullen Rd
- 6221 Albervan St
- 6220 Albervan St
- 6131 Albervan St
- 6201 Mullen Rd
- 14110 W 62nd Terrace
- 6110 Hallet St
- 14111 W 62nd Terrace
- 6104 Hallet St