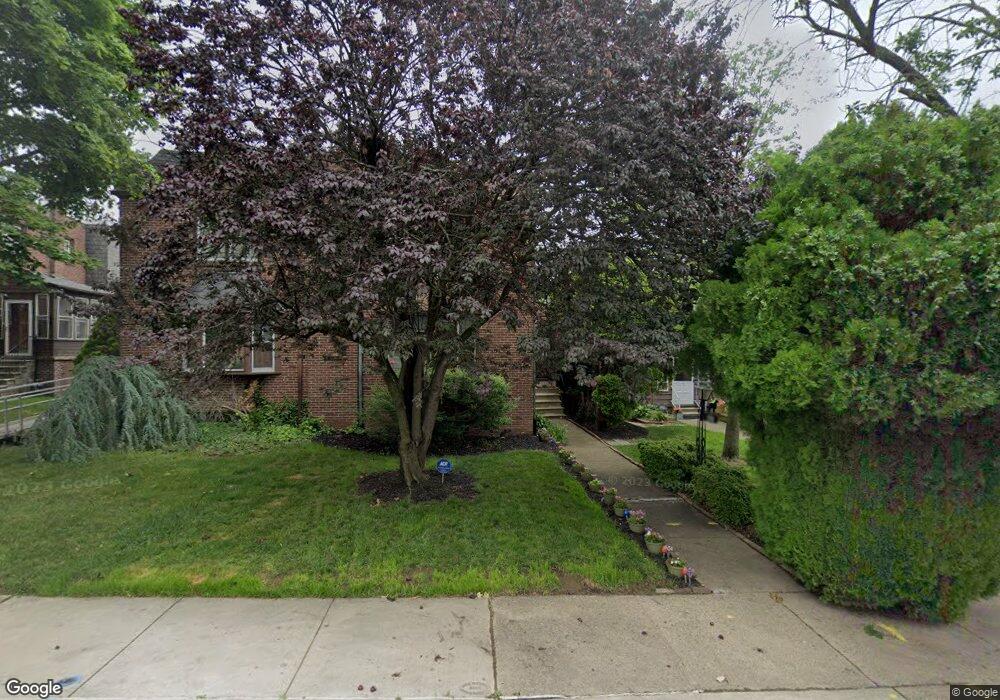
621 W 39th St Wilmington, DE 19802
Northwest Wilmington NeighborhoodEstimated Value: $304,000 - $439,000
4
Beds
3
Baths
2,142
Sq Ft
$174/Sq Ft
Est. Value
About This Home
This home is located at 621 W 39th St, Wilmington, DE 19802 and is currently estimated at $371,693, approximately $173 per square foot. 621 W 39th St is a home located in New Castle County with nearby schools including Harlan (David W. ) Elementary School, Pierre S. Dupont Middle School, and Concord High School.
Ownership History
Date
Name
Owned For
Owner Type
Purchase Details
Closed on
Dec 1, 2006
Sold by
Carroll Thornton C
Bought by
Carroll Thornton C and Carroll Joann R
Current Estimated Value
Home Financials for this Owner
Home Financials are based on the most recent Mortgage that was taken out on this home.
Original Mortgage
$217,200
Interest Rate
8.37%
Mortgage Type
New Conventional
Create a Home Valuation Report for This Property
The Home Valuation Report is an in-depth analysis detailing your home's value as well as a comparison with similar homes in the area
Home Values in the Area
Average Home Value in this Area
Purchase History
| Date | Buyer | Sale Price | Title Company |
|---|---|---|---|
| Carroll Thornton C | -- | None Available |
Source: Public Records
Mortgage History
| Date | Status | Borrower | Loan Amount |
|---|---|---|---|
| Closed | Carroll Thornton C | $217,200 |
Source: Public Records
Tax History Compared to Growth
Tax History
| Year | Tax Paid | Tax Assessment Tax Assessment Total Assessment is a certain percentage of the fair market value that is determined by local assessors to be the total taxable value of land and additions on the property. | Land | Improvement |
|---|---|---|---|---|
| 2024 | $1,961 | $60,700 | $9,400 | $51,300 |
| 2023 | $1,780 | $60,700 | $9,400 | $51,300 |
| 2022 | $1,800 | $60,700 | $9,400 | $51,300 |
| 2021 | $1,797 | $60,700 | $9,400 | $51,300 |
| 2020 | $1,800 | $60,700 | $9,400 | $51,300 |
| 2019 | $3,020 | $60,700 | $9,400 | $51,300 |
| 2018 | $1,741 | $60,700 | $9,400 | $51,300 |
| 2017 | $1,728 | $60,700 | $9,400 | $51,300 |
| 2016 | $1,727 | $60,700 | $9,400 | $51,300 |
| 2015 | $2,693 | $60,700 | $9,400 | $51,300 |
| 2014 | $2,692 | $60,700 | $9,400 | $51,300 |
Source: Public Records
Map
Nearby Homes
- 804 W Matson Run Pkwy
- 3601 N Madison St
- 4316 Miller Rd
- 4318 Miller Rd
- 4314 Miller Rd
- 3606 N West St
- 3202 N Monroe St
- 700 W 31st St
- 18 W 38th St
- 16 W 38th St
- 616 W 31st St
- 104 W 35th St
- 3017 N Madison St
- 592 W 30th St
- 596 W 30th St
- 594 W 30th St
- 590 W 30th St
- 310 W 31st St
- 2917 N Monroe St
- 2905 N Madison St