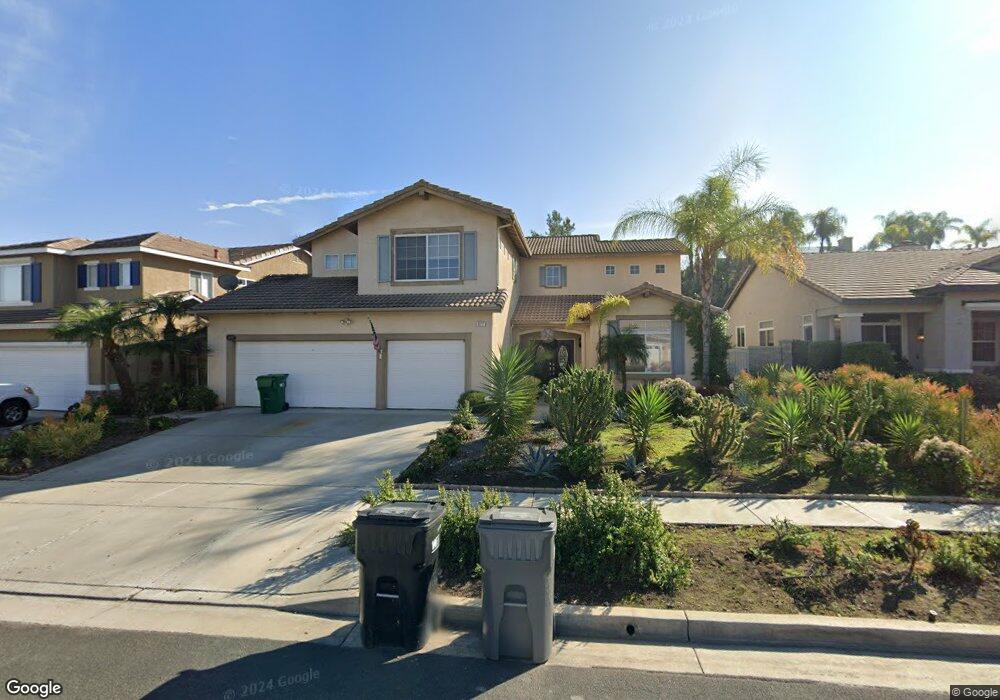
622 Bundy Way Corona, CA 92882
South Corona NeighborhoodEstimated Value: $900,000 - $989,000
5
Beds
3
Baths
2,875
Sq Ft
$335/Sq Ft
Est. Value
About This Home
This home is located at 622 Bundy Way, Corona, CA 92882 and is currently estimated at $964,278, approximately $335 per square foot. 622 Bundy Way is a home located in Riverside County with nearby schools including Dwight D. Eisenhower Elementary School, Citrus Hills Intermediate School, and Santiago High School.
Ownership History
Date
Name
Owned For
Owner Type
Purchase Details
Closed on
Nov 22, 2005
Sold by
Yngente Emmanuel V
Bought by
Yngente Emmanuel and Yngente Magnolia
Current Estimated Value
Home Financials for this Owner
Home Financials are based on the most recent Mortgage that was taken out on this home.
Original Mortgage
$300,000
Interest Rate
6.99%
Mortgage Type
Balloon
Purchase Details
Closed on
Apr 20, 2004
Sold by
Yngente Magnolia F
Bought by
Yngente Emmanuel
Home Financials for this Owner
Home Financials are based on the most recent Mortgage that was taken out on this home.
Original Mortgage
$145,000
Interest Rate
5.5%
Mortgage Type
Stand Alone Refi Refinance Of Original Loan
Purchase Details
Closed on
Nov 12, 1996
Sold by
2728 Holding Corp
Bought by
Yngente Emmanuel and Yngente Magnolia F
Home Financials for this Owner
Home Financials are based on the most recent Mortgage that was taken out on this home.
Original Mortgage
$162,400
Interest Rate
5.82%
Mortgage Type
Purchase Money Mortgage
Create a Home Valuation Report for This Property
The Home Valuation Report is an in-depth analysis detailing your home's value as well as a comparison with similar homes in the area
Home Values in the Area
Average Home Value in this Area
Purchase History
| Date | Buyer | Sale Price | Title Company |
|---|---|---|---|
| Yngente Emmanuel | -- | Chicago Title Company | |
| Yngente Emmanuel | -- | Stewart Title Of Ca Inc | |
| Yngente Emmanuel | $203,500 | Stewart Title |
Source: Public Records
Mortgage History
| Date | Status | Borrower | Loan Amount |
|---|---|---|---|
| Previous Owner | Yngente Emmanuel | $300,000 | |
| Previous Owner | Yngente Emmanuel | $145,000 | |
| Previous Owner | Yngente Emmanuel | $162,400 |
Source: Public Records
Tax History
| Year | Tax Paid | Tax Assessment Tax Assessment Total Assessment is a certain percentage of the fair market value that is determined by local assessors to be the total taxable value of land and additions on the property. | Land | Improvement |
|---|---|---|---|---|
| 2025 | $4,349 | $361,940 | $73,269 | $288,671 |
| 2023 | $4,349 | $347,887 | $70,425 | $277,462 |
| 2022 | $4,222 | $341,067 | $69,045 | $272,022 |
| 2021 | $4,146 | $334,381 | $67,692 | $266,689 |
| 2020 | $4,104 | $330,953 | $66,998 | $263,955 |
| 2019 | $4,144 | $324,465 | $65,685 | $258,780 |
| 2018 | $5,115 | $318,104 | $64,398 | $253,706 |
| 2017 | $5,101 | $311,868 | $63,136 | $248,732 |
| 2016 | $5,061 | $305,754 | $61,899 | $243,855 |
| 2015 | $4,984 | $301,163 | $60,970 | $240,193 |
| 2014 | $4,905 | $295,266 | $59,777 | $235,489 |
Source: Public Records
Map
Nearby Homes
- 435 Rembrandt Dr
- 664 Rembrandt Cir
- 142 Tamarack Dr
- 3527 Galatea Way
- 2979 McDonald Ln
- 833 W Orange Height Ln
- 532 W Orange Height Ln
- 3735 Hilgard St
- 342 Selkirk Dr
- 3933 Malaga St
- 457 Minaret St
- 660 Glen Springs Ln
- 825 Derby St
- 3960 Ibbetson St
- 2885 Citrocado Ranch St
- 3100 Garretson Ave
- 3995 Holly Springs Dr
- 3312 Clearing Ln
- 3185 Sonrisa Dr
- 3740 Coleville Cir
Your Personal Tour Guide
Ask me questions while you tour the home.