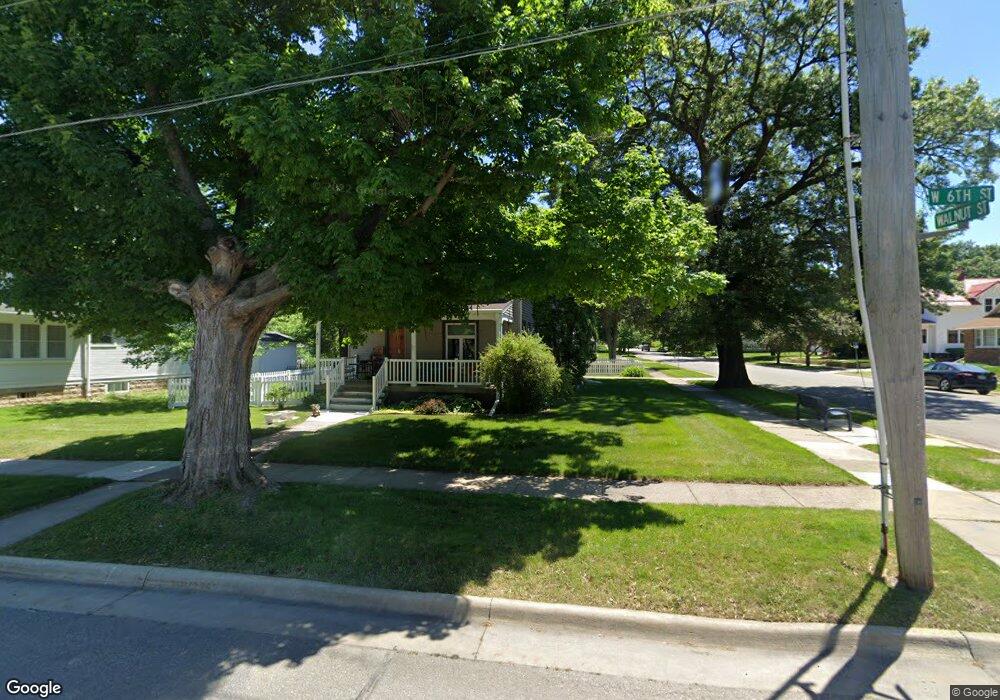
622 W 6th St Cedar Falls, IA 50613
Estimated Value: $227,000 - $366,000
4
Beds
1
Bath
1,732
Sq Ft
$158/Sq Ft
Est. Value
About This Home
This home is located at 622 W 6th St, Cedar Falls, IA 50613 and is currently estimated at $273,079, approximately $157 per square foot. 622 W 6th St is a home located in Black Hawk County with nearby schools including Lincoln Elementary School, Holmes Junior High School, and Cedar Falls High School.
Ownership History
Date
Name
Owned For
Owner Type
Purchase Details
Closed on
Jun 24, 2021
Sold by
Weedman Matthew J
Bought by
Morgan Rachel E
Current Estimated Value
Home Financials for this Owner
Home Financials are based on the most recent Mortgage that was taken out on this home.
Original Mortgage
$165,000
Outstanding Balance
$149,387
Interest Rate
2.9%
Mortgage Type
New Conventional
Estimated Equity
$123,692
Purchase Details
Closed on
Jan 4, 2019
Sold by
King Scott K and Deadlow Kelsey A
Bought by
Santomauro Steven J and Santomauro Rachel M
Purchase Details
Closed on
Mar 20, 2015
Sold by
Robbins Monica M
Bought by
Morgan Rachel E and Weedman Matthew J
Home Financials for this Owner
Home Financials are based on the most recent Mortgage that was taken out on this home.
Original Mortgage
$21,300
Interest Rate
3.73%
Mortgage Type
Closed End Mortgage
Create a Home Valuation Report for This Property
The Home Valuation Report is an in-depth analysis detailing your home's value as well as a comparison with similar homes in the area
Home Values in the Area
Average Home Value in this Area
Purchase History
| Date | Buyer | Sale Price | Title Company |
|---|---|---|---|
| Morgan Rachel E | -- | None Available | |
| Santomauro Steven J | $193,450 | -- | |
| Koch John E | -- | -- | |
| Morgan Rachel E | $213,000 | None Available |
Source: Public Records
Mortgage History
| Date | Status | Borrower | Loan Amount |
|---|---|---|---|
| Open | Morgan Rachel E | $165,000 | |
| Previous Owner | Morgan Rachel E | $21,300 | |
| Previous Owner | Morgan Rachel E | $170,800 |
Source: Public Records
Tax History Compared to Growth
Tax History
| Year | Tax Paid | Tax Assessment Tax Assessment Total Assessment is a certain percentage of the fair market value that is determined by local assessors to be the total taxable value of land and additions on the property. | Land | Improvement |
|---|---|---|---|---|
| 2025 | $3,370 | $252,810 | $48,510 | $204,300 |
| 2024 | $3,370 | $219,610 | $32,340 | $187,270 |
| 2023 | $3,156 | $219,610 | $32,340 | $187,270 |
| 2022 | $3,192 | $179,800 | $32,340 | $147,460 |
| 2021 | $2,976 | $179,800 | $32,340 | $147,460 |
| 2020 | $2,914 | $168,480 | $21,020 | $147,460 |
| 2019 | $2,914 | $168,480 | $21,020 | $147,460 |
| 2018 | $2,952 | $168,480 | $21,020 | $147,460 |
| 2017 | $3,020 | $168,480 | $21,020 | $147,460 |
| 2016 | $2,188 | $168,480 | $21,020 | $147,460 |
| 2015 | $2,188 | $132,570 | $21,020 | $111,550 |
| 2014 | $2,390 | $133,760 | $21,020 | $112,740 |
Source: Public Records
Map
Nearby Homes