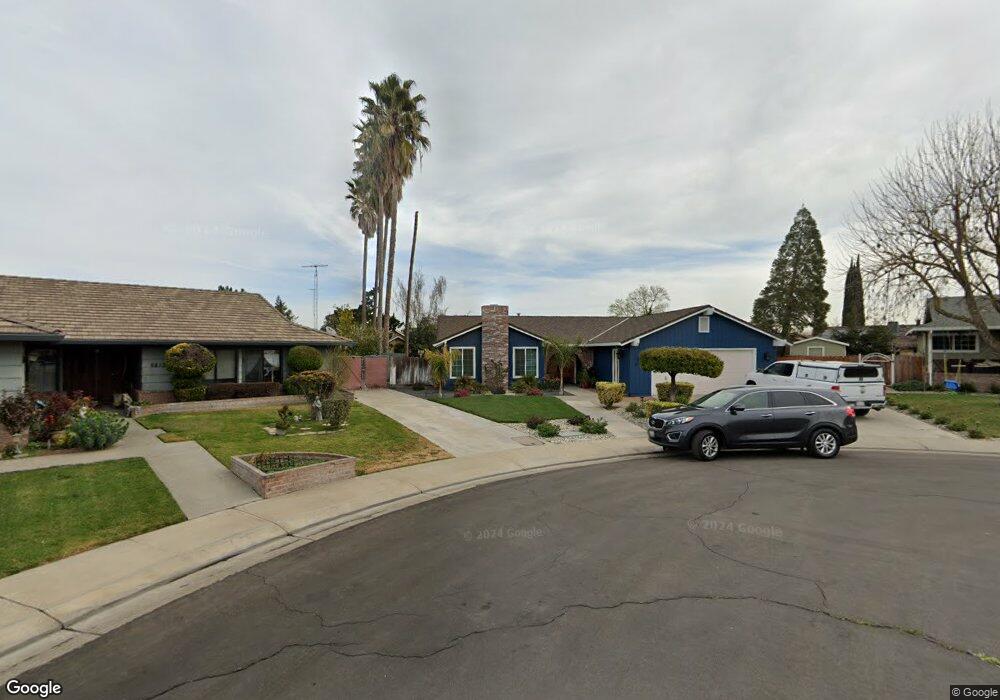
6223 Choctaw Ct Manteca, CA 95336
Estimated Value: $532,000 - $699,000
3
Beds
3
Baths
2,008
Sq Ft
$298/Sq Ft
Est. Value
About This Home
This home is located at 6223 Choctaw Ct, Manteca, CA 95336 and is currently estimated at $597,850, approximately $297 per square foot. 6223 Choctaw Ct is a home located in San Joaquin County with nearby schools including New Haven Elementary School and East Union High School.
Ownership History
Date
Name
Owned For
Owner Type
Purchase Details
Closed on
Jan 17, 2003
Sold by
Diaz John Leonardo
Bought by
Diaz John Leonardo and Diaz Theresa
Current Estimated Value
Purchase Details
Closed on
Dec 11, 2001
Sold by
Diaz Theresa
Bought by
Diaz John Leonardo
Home Financials for this Owner
Home Financials are based on the most recent Mortgage that was taken out on this home.
Original Mortgage
$176,000
Outstanding Balance
$68,773
Interest Rate
6.57%
Estimated Equity
$529,077
Purchase Details
Closed on
Sep 11, 2000
Sold by
Bautista Isagani L and Bautista Grace M
Bought by
Diaz John Leonardo and Diaz Theresa
Home Financials for this Owner
Home Financials are based on the most recent Mortgage that was taken out on this home.
Original Mortgage
$156,512
Interest Rate
7.98%
Mortgage Type
FHA
Create a Home Valuation Report for This Property
The Home Valuation Report is an in-depth analysis detailing your home's value as well as a comparison with similar homes in the area
Purchase History
| Date | Buyer | Sale Price | Title Company |
|---|---|---|---|
| Diaz John Leonardo | -- | -- | |
| Diaz John Leonardo | -- | Old Republic Title Company | |
| Diaz John Leonardo | $166,363 | Chicago Title Co |
Source: Public Records
Mortgage History
| Date | Status | Borrower | Loan Amount |
|---|---|---|---|
| Open | Diaz John Leonardo | $176,000 | |
| Closed | Diaz John Leonardo | $156,512 |
Source: Public Records
Tax History
| Year | Tax Paid | Tax Assessment Tax Assessment Total Assessment is a certain percentage of the fair market value that is determined by local assessors to be the total taxable value of land and additions on the property. | Land | Improvement |
|---|---|---|---|---|
| 2025 | $7,888 | $317,099 | $60,265 | $256,834 |
| 2024 | $7,778 | $310,883 | $59,084 | $251,799 |
| 2023 | $7,702 | $304,788 | $57,926 | $246,862 |
| 2022 | $4,849 | $298,813 | $56,791 | $242,022 |
| 2021 | $5,163 | $292,955 | $55,678 | $237,277 |
| 2020 | $5,364 | $289,953 | $55,108 | $234,845 |
| 2019 | $5,133 | $284,269 | $54,028 | $230,241 |
| 2018 | $4,721 | $278,696 | $52,969 | $225,727 |
| 2017 | $4,585 | $273,232 | $51,931 | $221,301 |
| 2016 | $4,417 | $267,877 | $50,913 | $216,964 |
| 2014 | $4,129 | $258,688 | $49,167 | $209,521 |
Source: Public Records
Map
Nearby Homes
- 6288 E Lathrop Rd
- 1350 Laurel Dr
- 1859 Elmwood Ln
- 598 Southland Rd
- 13791 Castle Rd
- 756 Conrad St
- 484 Pinehurst St
- 1496 Crimson Ln
- 619 Heathridge St
- 889 Conrad St
- 927 Conrad St
- 854 Conrad St
- 403 Curtwood Ct
- 1449 Dorona Ln
- 1415 Crimson Ln
- 1479 Santini Ave
- 1701 Maywood Ave
- 2016 Westboro Ln
- 1342 Marceline Dr
- 1049 Briar Ct
- 6213 Choctaw Ct
- 6233 Choctaw Ct
- 14821 Seminole Way
- 14811 Seminole Way
- 6234 Yuma Way
- 6224 Yuma Way
- 14831 Seminole Way
- 6214 Yuma Way
- 14801 Seminole Way
- 14841 Seminole Way
- 14822 Pueblo Dr
- 14838 Pueblo Dr
- 6204 Yuma Way
- 14851 Seminole Way
- 14828 Seminole Way
- 6226 Choctaw Ct
- 14822 Seminole Way
- 14838 Seminole Way
- 14856 Pueblo Dr
- 6221 Yuma Way
Your Personal Tour Guide
Ask me questions while you tour the home.