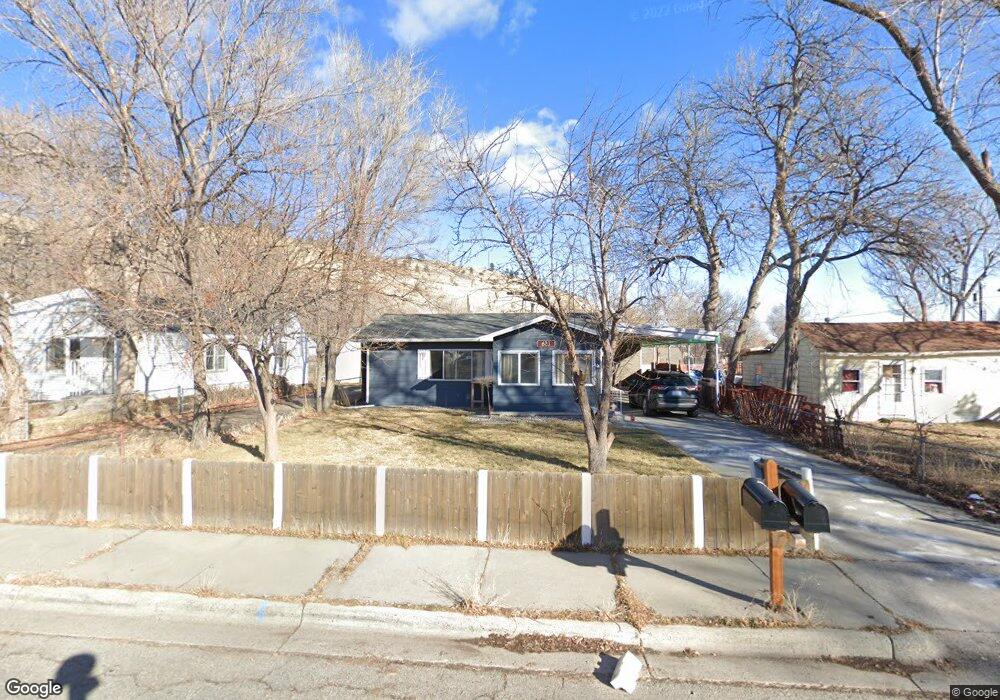
623 N 16th St Billings, MT 59101
North Side Billings NeighborhoodEstimated Value: $300,000 - $331,158
5
Beds
2
Baths
2,250
Sq Ft
$140/Sq Ft
Est. Value
About This Home
This home is located at 623 N 16th St, Billings, MT 59101 and is currently estimated at $314,790, approximately $139 per square foot. 623 N 16th St is a home located in Yellowstone County with nearby schools including McKinley School, Riverside Junior High School, and Billings Senior High School.
Ownership History
Date
Name
Owned For
Owner Type
Purchase Details
Closed on
May 20, 2020
Sold by
Rigney John M and Rigney Carrie
Bought by
Armstrong Dennis J and Armstrong Dorry N
Current Estimated Value
Home Financials for this Owner
Home Financials are based on the most recent Mortgage that was taken out on this home.
Original Mortgage
$139,565
Outstanding Balance
$110,823
Interest Rate
3.3%
Mortgage Type
Future Advance Clause Open End Mortgage
Estimated Equity
$203,967
Purchase Details
Closed on
Oct 12, 2016
Sold by
Paynter Andrew David
Bought by
Rigney Carrie and Rigney John M
Purchase Details
Closed on
Sep 8, 2006
Sold by
Dunster Ryan
Bought by
Paynter Andrew David
Home Financials for this Owner
Home Financials are based on the most recent Mortgage that was taken out on this home.
Original Mortgage
$146,740
Interest Rate
6.67%
Mortgage Type
FHA
Create a Home Valuation Report for This Property
The Home Valuation Report is an in-depth analysis detailing your home's value as well as a comparison with similar homes in the area
Home Values in the Area
Average Home Value in this Area
Purchase History
| Date | Buyer | Sale Price | Title Company |
|---|---|---|---|
| Armstrong Dennis J | -- | Chicago Title Insurance Co | |
| Rigney Carrie | -- | First Montana Title | |
| Paynter Andrew David | -- | None Available |
Source: Public Records
Mortgage History
| Date | Status | Borrower | Loan Amount |
|---|---|---|---|
| Open | Armstrong Dennis J | $139,565 | |
| Previous Owner | Paynter Andrew David | $146,740 |
Source: Public Records
Tax History Compared to Growth
Tax History
| Year | Tax Paid | Tax Assessment Tax Assessment Total Assessment is a certain percentage of the fair market value that is determined by local assessors to be the total taxable value of land and additions on the property. | Land | Improvement |
|---|---|---|---|---|
| 2025 | $2,732 | $344,142 | $39,332 | $304,810 |
| 2024 | $2,732 | $285,038 | $38,678 | $246,360 |
| 2023 | $2,765 | $285,038 | $38,678 | $246,360 |
| 2022 | $2,540 | $229,895 | $31,825 | $198,070 |
| 2021 | $2,454 | $229,895 | $0 | $0 |
| 2020 | $2,527 | $229,084 | $0 | $0 |
| 2019 | $2,499 | $238,294 | $0 | $0 |
| 2018 | $1,966 | $179,830 | $0 | $0 |
| 2017 | $1,909 | $179,830 | $0 | $0 |
| 2016 | $1,737 | $164,660 | $0 | $0 |
| 2015 | $1,698 | $164,660 | $0 | $0 |
| 2014 | $1,530 | $78,352 | $0 | $0 |
Source: Public Records
Map
Nearby Homes
- 612 N 15th St
- 722 N 17th St
- 823 N 18th St
- 901 N 19th St
- 2004 9th Ave N
- 1363 Montana Ave Unit 301
- 1363 Montana Ave Unit 303
- 1363 Montana Ave Unit 302
- 2214 6th Ave N
- 945 N 23rd St
- 715 N 24th St
- TBD Tumbleweed Dr
- 111 N 23rd St
- Lot C Alkali Creek Rd
- 607 26th St W
- 300 N 25th St Unit 401
- 1130 N 23rd St
- 1121 N 24th St
- 1114 N 24th St
- 1143 N 24th St