Colorado
Jefferson County
Littleton
80127
Foothill Green
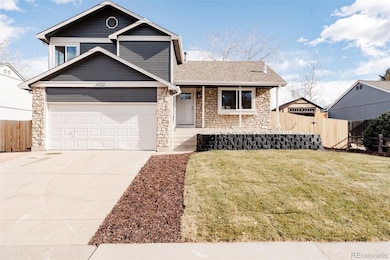
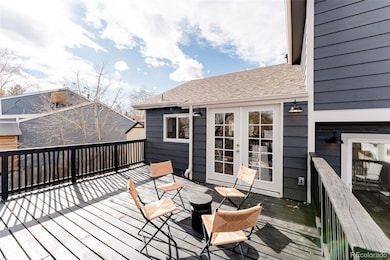
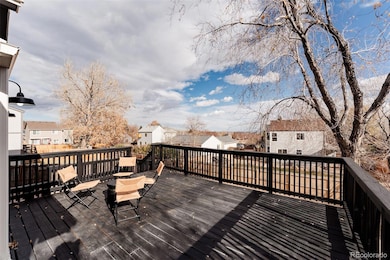
6232 S Owens Ct, Littleton, CO
Disclaimer: Certain information contained herein is derived from information provided by parties other than Homes.com. All information provided is deemed reliable, but is not guaranteed to be accurate and should be independently verified.
 The content relating to real estate for sale in this Web site comes in part from the Internet Data eXchange (“IDX”) program of METROLIST, INC., DBA RECOLORADO®. Real estate listings held by brokers other than Ten-X are marked with the IDX Logo. This information is being provided for the consumers’ personal, non-commercial use and may not be used for any other purpose. All information subject to change and should be independently verified.
This publication is designed to provide information with regard to the subject matter covered. It is displayed with the understanding that the publisher and authors are not engaged in rendering real estate, legal, accounting, tax, or other professional services and that the publisher and authors are not offering such advice in this publication. If real estate, legal, or other expert assistance is required, the services of a competent, professional person should be sought.
The information contained in this publication is subject to change without notice. METROLIST, INC., DBA RECOLORADO MAKES NO WARRANTY OF ANY KIND WITH REGARD TO THIS MATERIAL, INCLUDING, BUT NOT LIMITED TO, THE IMPLIED WARRANTIES OF MERCHANTABILITY AND FITNESS FOR A PARTICULAR PURPOSE. METROLIST, INC., DBA RECOLORADO SHALL NOT BE LIABLE FOR ERRORS CONTAINED HEREIN OR FOR ANY DAMAGES IN CONNECTION WITH THE FURNISHING, PERFORMANCE, OR USE OF THIS MATERIAL.
PUBLISHER’S NOTICE: All real estate advertised herein is subject to the Federal Fair Housing Act and the Colorado Fair Housing Act, which Acts make it illegal to make or publish any advertisement that indicates any preference, limitation, or discrimination based on race, color, religion, sex, handicap, familial status, or national origin.
METROLIST, INC., DBA RECOLORADO will not knowingly accept any advertising for real estate that is in violation of the law. All persons are hereby informed that all dwellings advertised are available on an equal opportunity basis.
© 2025 METROLIST, INC., DBA RECOLORADO® – All Rights Reserved. 6455 S. Yosemite St., Suite 500 Greenwood Village, CO 80111 USA
ALL RIGHTS RESERVED WORLDWIDE. No part of this publication may be reproduced, adapted, translated, stored in a retrieval system or transmitted in any form or by any means, electronic, mechanical, photocopying, recording, or otherwise, without the prior written permission of the publisher. The information contained herein including but not limited to all text, photographs, digital images, virtual tours, may be seeded and monitored for protection and tracking.