Estimated Value: $695,014 - $767,000
3
Beds
2
Baths
1,242
Sq Ft
$591/Sq Ft
Est. Value
About This Home
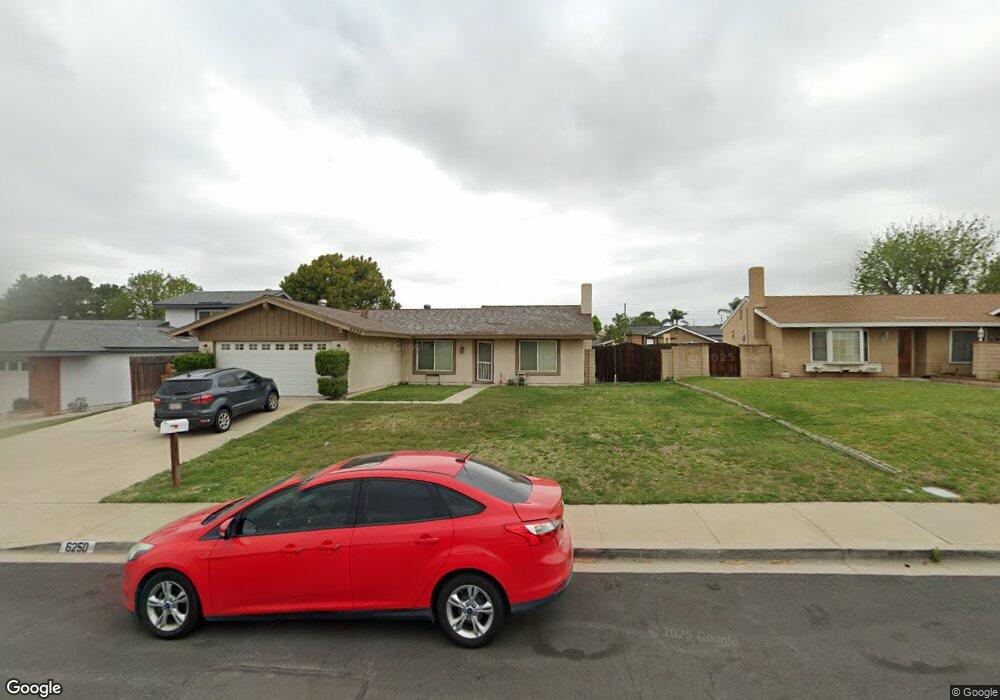
This home is located at 6250 Grant St, Chino, CA 91710 and is currently estimated at $734,504, approximately $591 per square foot. 6250 Grant St is a home located in San Bernardino County with nearby schools including Alicia Cortez Elementary, Magnolia Junior High, and Chino High School.
Ownership History
Date
Name
Owned For
Owner Type
Purchase Details
Closed on
Nov 9, 2017
Sold by
2017-2 Ih Borrower Lp
Bought by
2017-2 Ih Borrower Lp
Current Estimated Value
Home Financials for this Owner
Home Financials are based on the most recent Mortgage that was taken out on this home.
Original Mortgage
$865,027,000
Outstanding Balance
$726,568,288
Interest Rate
3.94%
Mortgage Type
Commercial
Estimated Equity
-$725,833,784
Purchase Details
Closed on
Oct 13, 2014
Sold by
Thr California Lp
Bought by
2014 3 Ih Borrower Lp
Purchase Details
Closed on
Sep 28, 2012
Sold by
Davis Kristy
Bought by
Thr California Llc
Purchase Details
Closed on
Jun 29, 2006
Sold by
Gunn James Michael
Bought by
Ultreras Francisco and Davis Kristy
Home Financials for this Owner
Home Financials are based on the most recent Mortgage that was taken out on this home.
Original Mortgage
$392,000
Interest Rate
7.3%
Mortgage Type
Stand Alone First
Create a Home Valuation Report for This Property
The Home Valuation Report is an in-depth analysis detailing your home's value as well as a comparison with similar homes in the area
Home Values in the Area
Average Home Value in this Area
Purchase History
| Date | Buyer | Sale Price | Title Company |
|---|---|---|---|
| 2017-2 Ih Borrower Lp | -- | None Available | |
| 2014 3 Ih Borrower Lp | -- | None Available | |
| Thr California Llc | $238,000 | Chicago Title Company | |
| Ultreras Francisco | $490,000 | Investors Title Company |
Source: Public Records
Mortgage History
| Date | Status | Borrower | Loan Amount |
|---|---|---|---|
| Open | 2017-2 Ih Borrower Lp | $865,027,000 | |
| Previous Owner | Ultreras Francisco | $392,000 |
Source: Public Records
Tax History Compared to Growth
Tax History
| Year | Tax Paid | Tax Assessment Tax Assessment Total Assessment is a certain percentage of the fair market value that is determined by local assessors to be the total taxable value of land and additions on the property. | Land | Improvement |
|---|---|---|---|---|
| 2025 | $5,418 | $499,052 | $174,089 | $324,963 |
| 2024 | $5,418 | $489,266 | $170,675 | $318,591 |
| 2023 | $5,268 | $479,672 | $167,328 | $312,344 |
| 2022 | $5,237 | $470,267 | $164,047 | $306,220 |
| 2021 | $5,135 | $461,046 | $160,830 | $300,216 |
| 2020 | $5,068 | $456,319 | $159,181 | $297,138 |
| 2019 | $4,980 | $447,372 | $156,060 | $291,312 |
| 2018 | $4,870 | $438,600 | $153,000 | $285,600 |
| 2017 | $2,821 | $252,527 | $79,578 | $172,949 |
| 2016 | $2,637 | $247,576 | $78,018 | $169,558 |
| 2015 | $3,749 | $355,000 | $125,000 | $230,000 |
| 2014 | $2,533 | $239,081 | $75,341 | $163,740 |
Source: Public Records
Map
Nearby Homes
- 12689 Cypress Ave
- 12765 Ross Ave
- 12524 Ross Ave
- 6542 Hamilton St
- 6016 Harrison St
- 12811 Oaks Ave
- 13014 Bermuda Ave
- 6061 Barbara St
- 6667 King St
- 2321 S Magnolia Ave Unit 6E
- 1135 W Whittlers Ln Unit 49
- 13022 Cypress Ave
- 5925 Riverside Dr Unit 12
- 12947 Robin Ln
- 13006 Falcon Place
- 6703 Poinsettia Ct
- 6648 Riverside Dr Unit 3
- 12796 17th St
- 6703 Aster Ct
- 6763 Poinsettia Ct