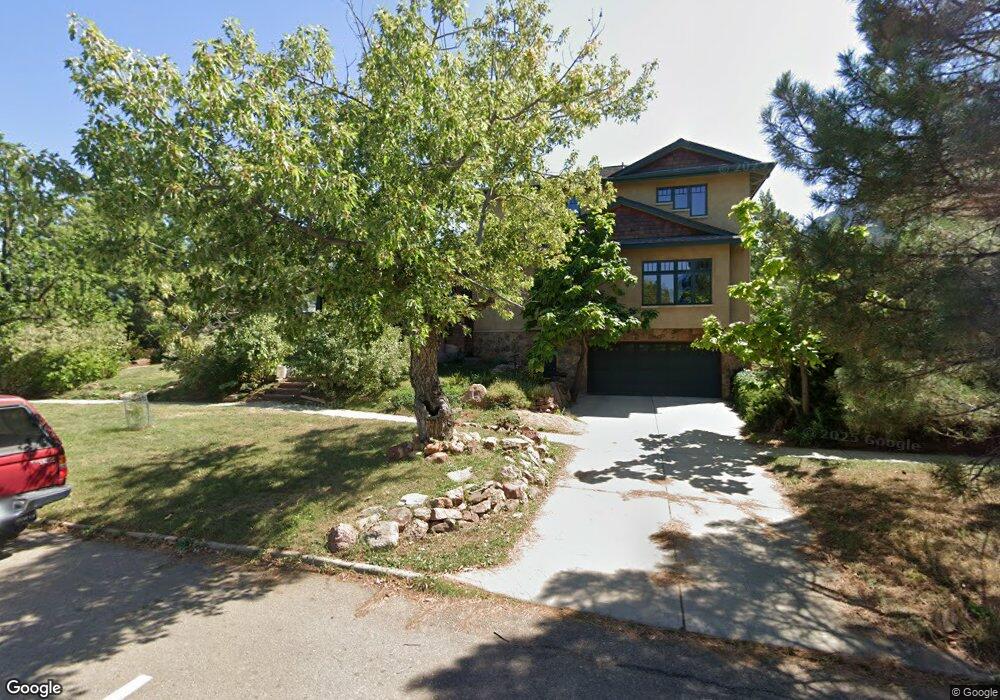
626 Cascade Ave Boulder, CO 80302
University Hill NeighborhoodEstimated Value: $3,597,202 - $5,149,000
5
Beds
5
Baths
5,385
Sq Ft
$812/Sq Ft
Est. Value
About This Home
This home is located at 626 Cascade Ave, Boulder, CO 80302 and is currently estimated at $4,373,051, approximately $812 per square foot. 626 Cascade Ave is a home located in Boulder County with nearby schools including Flatirons Elementary School, Manhattan Middle School of the Arts & Academics, and Boulder High School.
Ownership History
Date
Name
Owned For
Owner Type
Purchase Details
Closed on
Dec 28, 2006
Sold by
Naumann Robert C
Bought by
Robert C Naumann Living Trust
Current Estimated Value
Purchase Details
Closed on
Apr 14, 2003
Sold by
Anderson Nancy G
Bought by
Naumann Robert C
Purchase Details
Closed on
Jul 25, 2000
Sold by
Naumann Robert C
Bought by
Naumann Robert C
Purchase Details
Closed on
Jun 1, 1998
Sold by
Howard Rader Trust & Dena Rader Trust
Bought by
Naumann Robert C
Home Financials for this Owner
Home Financials are based on the most recent Mortgage that was taken out on this home.
Original Mortgage
$250,000
Interest Rate
7.17%
Purchase Details
Closed on
Apr 26, 1989
Bought by
Naumann Robert C Living Trust
Create a Home Valuation Report for This Property
The Home Valuation Report is an in-depth analysis detailing your home's value as well as a comparison with similar homes in the area
Home Values in the Area
Average Home Value in this Area
Purchase History
| Date | Buyer | Sale Price | Title Company |
|---|---|---|---|
| Robert C Naumann Living Trust | -- | None Available | |
| Naumann Robert C | -- | -- | |
| Naumann Robert C | -- | -- | |
| Naumann Robert C | $475,000 | First American Heritage Titl | |
| Naumann Robert C Living Trust | -- | -- |
Source: Public Records
Mortgage History
| Date | Status | Borrower | Loan Amount |
|---|---|---|---|
| Previous Owner | Naumann Robert C | $250,000 |
Source: Public Records
Tax History
| Year | Tax Paid | Tax Assessment Tax Assessment Total Assessment is a certain percentage of the fair market value that is determined by local assessors to be the total taxable value of land and additions on the property. | Land | Improvement |
|---|---|---|---|---|
| 2025 | $21,730 | $245,206 | $124,731 | $120,475 |
| 2024 | $21,730 | $245,206 | $124,731 | $120,475 |
| 2023 | $21,353 | $253,957 | $128,680 | $128,961 |
| 2022 | $20,101 | $223,407 | $108,566 | $114,841 |
| 2021 | $19,168 | $229,837 | $111,690 | $118,147 |
| 2020 | $16,804 | $200,201 | $105,391 | $94,810 |
| 2019 | $16,826 | $200,201 | $105,391 | $94,810 |
| 2018 | $16,761 | $200,520 | $84,960 | $115,560 |
| 2017 | $16,236 | $234,979 | $94,008 | $140,971 |
| 2016 | $13,767 | $166,993 | $66,784 | $100,209 |
| 2015 | $13,036 | $137,573 | $74,824 | $62,749 |
| 2014 | $10,898 | $137,573 | $74,824 | $62,749 |
Source: Public Records
Map
Nearby Homes
- 820 6th St
- 611 Cascade Ave Unit 7
- 440 Christmas Tree Dr
- 751 Grant Place
- 800 Grant Place
- 770 Circle Dr
- 964 Grant Place
- 911 Lincoln Place
- 505 Geneva Ave
- 1021 9th St
- 780 College Ave
- 1128 Lincoln Place
- 839 13th St
- 650 12th St
- 610 University Ave
- 972 Pleasant St
- 851 14th St
- 333 Bellevue Dr
- 920 University Ave
- 715 14th St
- 771 7th St
- 600 Cascade Ave
- 755 7th St
- 675 Cascade Ave
- 770 6th St
- 770 7th St
- 615 Cascade Ave Unit 12
- 619 Cascade Ave Unit 10
- 621 Cascade Ave Unit 9
- 607 Cascade Ave Unit 5
- 601 Cascade Ave Unit 2
- 615 Cascade Ave
- 756 6th St
- 815 7th St
- 613 Cascade Ave Unit 1
- 725 7th St
- 707 Cascade Ave
- 750 7th St
- 617 Cascade Ave Unit 11
- 609 Cascade Ave Unit 6
Your Personal Tour Guide
Ask me questions while you tour the home.