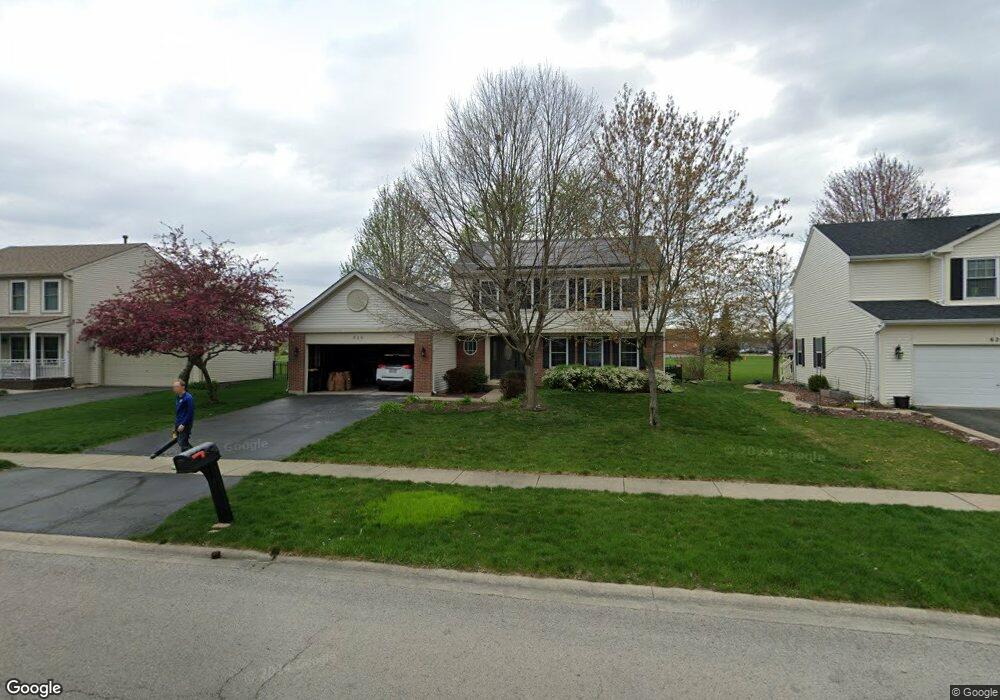
626 Pearces Ford Oswego, IL 60543
North Oswego NeighborhoodEstimated Value: $433,000 - $449,000
4
Beds
3
Baths
2,218
Sq Ft
$200/Sq Ft
Est. Value
About This Home
This home is located at 626 Pearces Ford, Oswego, IL 60543 and is currently estimated at $443,007, approximately $199 per square foot. 626 Pearces Ford is a home located in Kendall County with nearby schools including Old Post Elementary School, Thompson Jr. High School, and Oswego High School.
Ownership History
Date
Name
Owned For
Owner Type
Purchase Details
Closed on
May 23, 2016
Sold by
Sabin Steven J and Sabin Christine
Bought by
Cooper James A and Cooper Brianna R
Current Estimated Value
Home Financials for this Owner
Home Financials are based on the most recent Mortgage that was taken out on this home.
Original Mortgage
$21,750
Outstanding Balance
$17,361
Interest Rate
3.66%
Mortgage Type
Credit Line Revolving
Estimated Equity
$425,646
Purchase Details
Closed on
May 8, 1998
Sold by
Oak Brook Bank
Bought by
Sabin Steven J and Sabin Christine
Home Financials for this Owner
Home Financials are based on the most recent Mortgage that was taken out on this home.
Original Mortgage
$175,500
Interest Rate
7%
Purchase Details
Closed on
Dec 30, 1997
Sold by
First Suburban National Bank
Bought by
Oak Brook Bank
Create a Home Valuation Report for This Property
The Home Valuation Report is an in-depth analysis detailing your home's value as well as a comparison with similar homes in the area
Home Values in the Area
Average Home Value in this Area
Purchase History
| Date | Buyer | Sale Price | Title Company |
|---|---|---|---|
| Cooper James A | $220,000 | Near North National Title | |
| Sabin Steven J | $185,500 | -- | |
| Oak Brook Bank | -- | Chicago Title Insurance Co |
Source: Public Records
Mortgage History
| Date | Status | Borrower | Loan Amount |
|---|---|---|---|
| Open | Cooper James A | $21,750 | |
| Open | Cooper James A | $176,000 | |
| Previous Owner | Sabin Steven J | $175,500 |
Source: Public Records
Tax History Compared to Growth
Tax History
| Year | Tax Paid | Tax Assessment Tax Assessment Total Assessment is a certain percentage of the fair market value that is determined by local assessors to be the total taxable value of land and additions on the property. | Land | Improvement |
|---|---|---|---|---|
| 2024 | $9,701 | $126,555 | $31,508 | $95,047 |
| 2023 | $8,652 | $111,995 | $27,883 | $84,112 |
| 2022 | $8,652 | $101,813 | $25,348 | $76,465 |
| 2021 | $8,342 | $95,153 | $23,690 | $71,463 |
| 2020 | $8,162 | $92,382 | $23,000 | $69,382 |
| 2019 | $8,036 | $89,714 | $23,000 | $66,714 |
| 2018 | $7,701 | $83,704 | $20,510 | $63,194 |
| 2017 | $7,636 | $80,484 | $19,721 | $60,763 |
| 2016 | $7,583 | $78,906 | $19,334 | $59,572 |
| 2015 | $7,702 | $76,608 | $18,771 | $57,837 |
| 2014 | -- | $74,376 | $18,224 | $56,152 |
| 2013 | -- | $75,127 | $18,408 | $56,719 |
Source: Public Records
Map
Nearby Homes
- 4 Circle Ct
- 39 Cayman Dr
- 47 Old Post Rd
- 40 Codorus Rd
- 420 Chesterfield Ct Unit 420
- 22 Sherwick Rd
- 19 Wyndham Dr Unit 10
- 30 Hampton Rd
- 9 Cebold Dr
- 28 Seneca Dr
- 73 Ingleshire Rd
- 34 Pembrooke Rd
- 3 Scarsdale Rd
- 117 Boulder Hill Pass Unit 117
- 3 Orchard Rd
- 123 Orchard Rd
- 2 Orchard Rd
- 29 Briarcliff Rd
- 215 Fernwood Rd
- 119 Garden Dr
- 626 Pearces Ford Rd
- 628 Pearces Ford
- 624 Pearces Ford
- 625 Pearces Ford Rd
- 630 Pearces Ford
- 622 Pearces Ford
- 623 Pearces Ford Rd
- 623 Pearces Ford
- 625 Pearces Ford
- 621 Pearces Ford
- 632 Pearces Ford
- 620 Pearces Ford
- 619 Pearces Ford
- 634 Pearces Ford
- 301 Francesca Ct
- 618 Pearces Ford
- 302 Francesca Ct
- 703 Lucky Ct
- 617 Pearces Ford
- 303 Francesca Ct