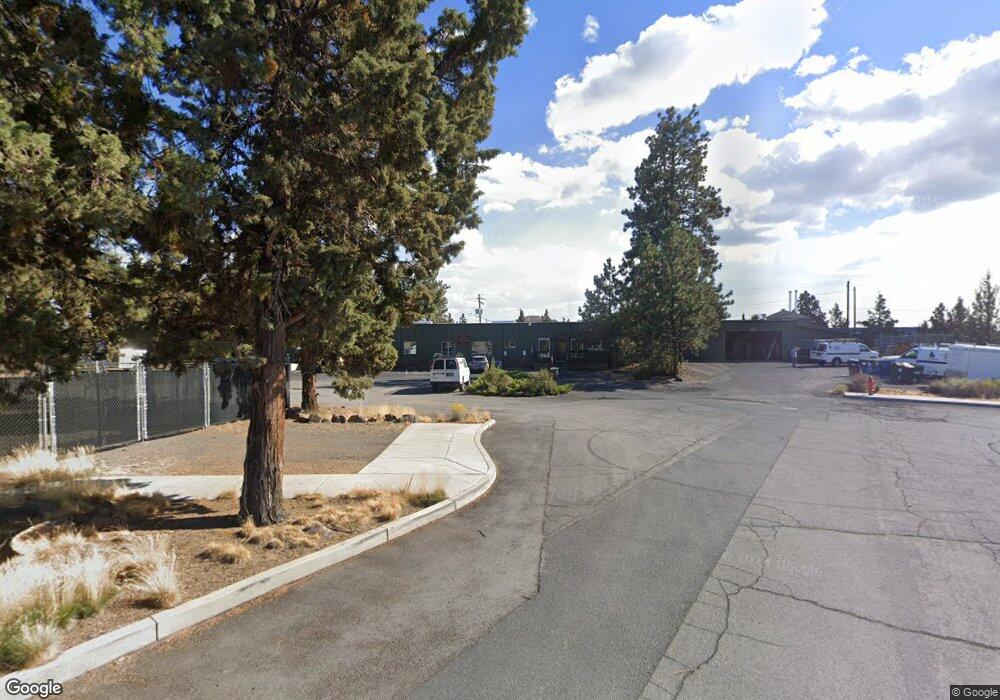
62880 Peerless Ct Bend, OR 97701
Boyd Acres NeighborhoodEstimated Value: $2,694,750
Studio
--
Bath
15,120
Sq Ft
$178/Sq Ft
Est. Value
About This Home
This home is located at 62880 Peerless Ct, Bend, OR 97701 and is currently estimated at $2,694,750, approximately $178 per square foot. 62880 Peerless Ct is a home located in Deschutes County with nearby schools including Lava Ridge Elementary School, Sky View Middle School, and Mountain View Senior High School.
Ownership History
Date
Name
Owned For
Owner Type
Purchase Details
Closed on
Nov 17, 2020
Sold by
Peerless I Llc and Peerless Ii Llc
Bought by
Peerless I Llc and Peerless Ii Llc
Current Estimated Value
Purchase Details
Closed on
Jun 26, 2018
Sold by
Warren Richard G and Warren Sharon R
Bought by
Moore Alan W and Moore Sunya E
Purchase Details
Closed on
Oct 23, 2017
Sold by
Moore Alan W and Moore Sunya E
Bought by
Peerless I Llc and Peerless Ii Llc
Home Financials for this Owner
Home Financials are based on the most recent Mortgage that was taken out on this home.
Original Mortgage
$531,000
Interest Rate
3.78%
Mortgage Type
Commercial
Purchase Details
Closed on
Aug 24, 2011
Sold by
Warren Richard G and Warren Sharon R
Bought by
Moore Alan W and Moore Sunya E
Home Financials for this Owner
Home Financials are based on the most recent Mortgage that was taken out on this home.
Original Mortgage
$809,993
Interest Rate
4.43%
Mortgage Type
Seller Take Back
Create a Home Valuation Report for This Property
The Home Valuation Report is an in-depth analysis detailing your home's value as well as a comparison with similar homes in the area
Home Values in the Area
Average Home Value in this Area
Purchase History
| Date | Buyer | Sale Price | Title Company |
|---|---|---|---|
| Peerless I Llc | -- | None Listed On Document | |
| Moore Alan W | -- | First American Title | |
| Peerless I Llc | $1,550,000 | First American Title | |
| Moore Alan W | $815,000 | First American Title |
Source: Public Records
Mortgage History
| Date | Status | Borrower | Loan Amount |
|---|---|---|---|
| Previous Owner | Peerless I Llc | $531,000 | |
| Previous Owner | Moore Alan W | $809,993 |
Source: Public Records
Tax History
| Year | Tax Paid | Tax Assessment Tax Assessment Total Assessment is a certain percentage of the fair market value that is determined by local assessors to be the total taxable value of land and additions on the property. | Land | Improvement |
|---|---|---|---|---|
| 2025 | $13,694 | $810,500 | -- | -- |
| 2024 | $13,175 | $786,900 | -- | -- |
| 2023 | $12,214 | $763,990 | $0 | $0 |
| 2022 | $11,395 | $720,137 | $0 | $0 |
| 2021 | $11,412 | $763,610 | $0 | $0 |
| 2020 | $11,825 | $763,610 | $0 | $0 |
| 2019 | $11,496 | $741,370 | $0 | $0 |
| 2018 | $11,171 | $719,780 | $0 | $0 |
| 2017 | $10,843 | $698,820 | $0 | $0 |
| 2016 | $10,340 | $678,470 | $0 | $0 |
| 2015 | $10,054 | $658,710 | $0 | $0 |
| 2014 | $9,758 | $639,530 | $0 | $0 |
Source: Public Records
Map
Nearby Homes
- 2843 NE Waller Dr
- 1482 NE Rumgay Ln
- 2642 NE Keats Dr
- 2640 NE 8th St
- 1407 NE Talon Ct
- 2667 NE Jones Rd
- 20530 NE Empire Ave
- 530 NE Majesty Ln
- 20534 Empire Ave
- 20532 NE Empire Ave
- 20528 NE Empire Ave
- 20514 NE Empire Ave
- 62906 Bilyeu Way
- 20560 Boyd Ct
- 20583 Sierra Dr
- 63150 Peale St
- 63149 NE Hadley Place
- 63153 NE Hadley Place
- 63163 Boyd Acres Rd
- 20668 Blanca Dr
- 62888 Oxford Ct
- 62820 Boyd Acres Rd
- 62885 Mercury Place
- 62828 Boyd Acres Rd
- 20657 Brinson Blvd
- 62890 Peerless Ct
- 822 NE Hidden Valley Dr Unit 1 & 2
- 62910 Peerless Ct
- 826 NE Hidden Valley Dr
- 830 NE Hidden Valley Dr Unit 1 & 2
- 830 NE Hidden Valley Dr
- 834 NE Hidden Valley Dr
- 827 NE Hidden Valley Dr
- 62860 Boyd Acres Rd Unit 8 & 9
- 62860 Boyd Acres Rd
- 62860 Boyd Acres Rd Unit C
- 62860 Boyd Acres Rd Unit 6 & 7
- 838 NE Hidden Valley Dr
- 842 NE Hidden Valley Dr
- 846 NE Hidden Valley Dr
Your Personal Tour Guide
Ask me questions while you tour the home.