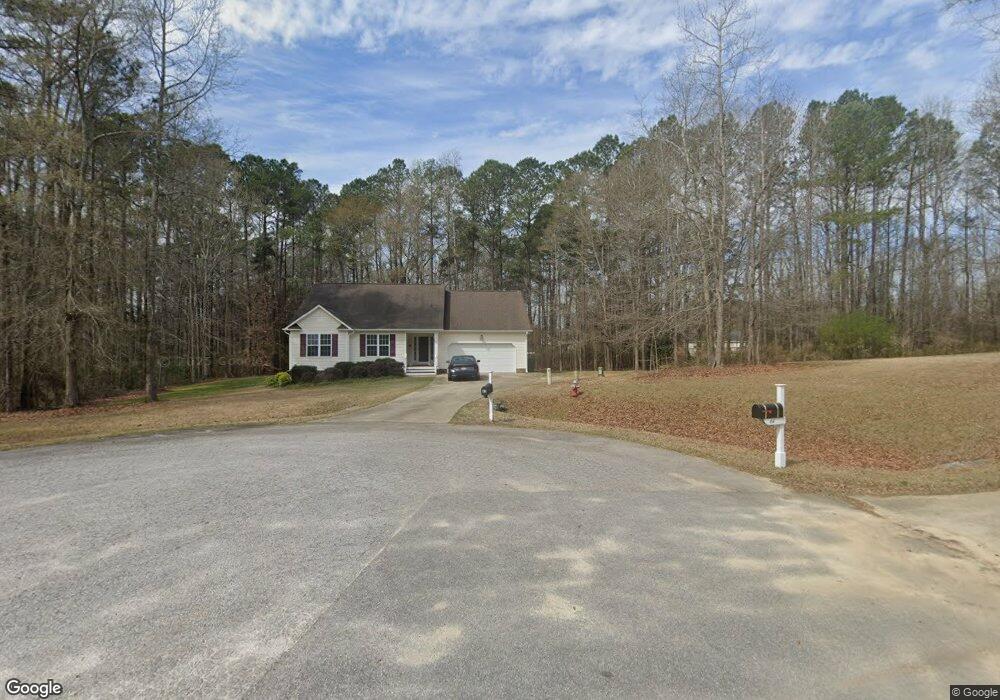
63 Acorn Ct Unit Rand Smithfield, NC 27577
Estimated Value: $320,013 - $347,000
3
Beds
2
Baths
1,438
Sq Ft
$231/Sq Ft
Est. Value
About This Home
This home is located at 63 Acorn Ct Unit Rand, Smithfield, NC 27577 and is currently estimated at $332,503, approximately $231 per square foot. 63 Acorn Ct Unit Rand is a home located in Johnston County with nearby schools including Polenta Elementary School, Swift Creek Middle, and Cleveland High School.
Ownership History
Date
Name
Owned For
Owner Type
Purchase Details
Closed on
Sep 22, 2021
Sold by
Chavis Jason Wayne and Chavis Melissa Barris
Bought by
Poulos Laila
Current Estimated Value
Home Financials for this Owner
Home Financials are based on the most recent Mortgage that was taken out on this home.
Original Mortgage
$100,000
Outstanding Balance
$76,331
Interest Rate
2.1%
Mortgage Type
New Conventional
Estimated Equity
$256,172
Purchase Details
Closed on
Jun 11, 2009
Sold by
Carroll Construction Homes Inc
Bought by
Chavis Jason Wayne and Chavis Melissa Barris
Home Financials for this Owner
Home Financials are based on the most recent Mortgage that was taken out on this home.
Original Mortgage
$156,900
Interest Rate
4.75%
Mortgage Type
Purchase Money Mortgage
Purchase Details
Closed on
Mar 4, 2008
Sold by
Son Lan Development Co Inc
Bought by
Carroll Construction Homes Inc
Create a Home Valuation Report for This Property
The Home Valuation Report is an in-depth analysis detailing your home's value as well as a comparison with similar homes in the area
Home Values in the Area
Average Home Value in this Area
Purchase History
| Date | Buyer | Sale Price | Title Company |
|---|---|---|---|
| Poulos Laila | $280,000 | None Available | |
| Chavis Jason Wayne | $156,000 | None Available | |
| Carroll Construction Homes Inc | $595,000 | None Available |
Source: Public Records
Mortgage History
| Date | Status | Borrower | Loan Amount |
|---|---|---|---|
| Open | Poulos Laila | $100,000 | |
| Previous Owner | Chavis Jason Wayne | $156,900 |
Source: Public Records
Tax History Compared to Growth
Tax History
| Year | Tax Paid | Tax Assessment Tax Assessment Total Assessment is a certain percentage of the fair market value that is determined by local assessors to be the total taxable value of land and additions on the property. | Land | Improvement |
|---|---|---|---|---|
| 2025 | $963 | $303,190 | $70,000 | $233,190 |
| 2024 | $723 | $178,580 | $40,000 | $138,580 |
| 2023 | $688 | $178,580 | $40,000 | $138,580 |
| 2022 | $1,411 | $178,580 | $40,000 | $138,580 |
| 2021 | $1,411 | $178,580 | $40,000 | $138,580 |
| 2020 | $1,464 | $178,580 | $40,000 | $138,580 |
| 2019 | $1,464 | $178,580 | $40,000 | $138,580 |
| 2018 | $1,316 | $156,710 | $30,000 | $126,710 |
| 2017 | $1,316 | $156,710 | $30,000 | $126,710 |
| 2016 | $1,316 | $156,710 | $30,000 | $126,710 |
| 2015 | $1,316 | $156,710 | $30,000 | $126,710 |
| 2014 | $1,316 | $156,710 | $30,000 | $126,710 |
Source: Public Records
Map
Nearby Homes
- 20 Pine Nut Ln
- 129 Serenity Dr
- 215 Harris Rd
- 312 Russ Rd
- 328 Avery Meadows Dr
- 5 Chinook St
- 37 Berg St
- 64 Berg St
- 409 Wildwood Ln
- 205 Shiloh Woods Cir
- 20 Shiloh Woods Cir
- 227 Blaze Ridge Dr
- 223 Shiloh Woods Cir
- 50 Shiloh Woods Cir
- 189 Gobbler Dr
- 122 Boss Shot Dr
- 140 Gobbler Dr
- 491 Blaze Ridge Dr
- Plan 2723 at Turkey Ridge
- Plan 2539 at Turkey Ridge