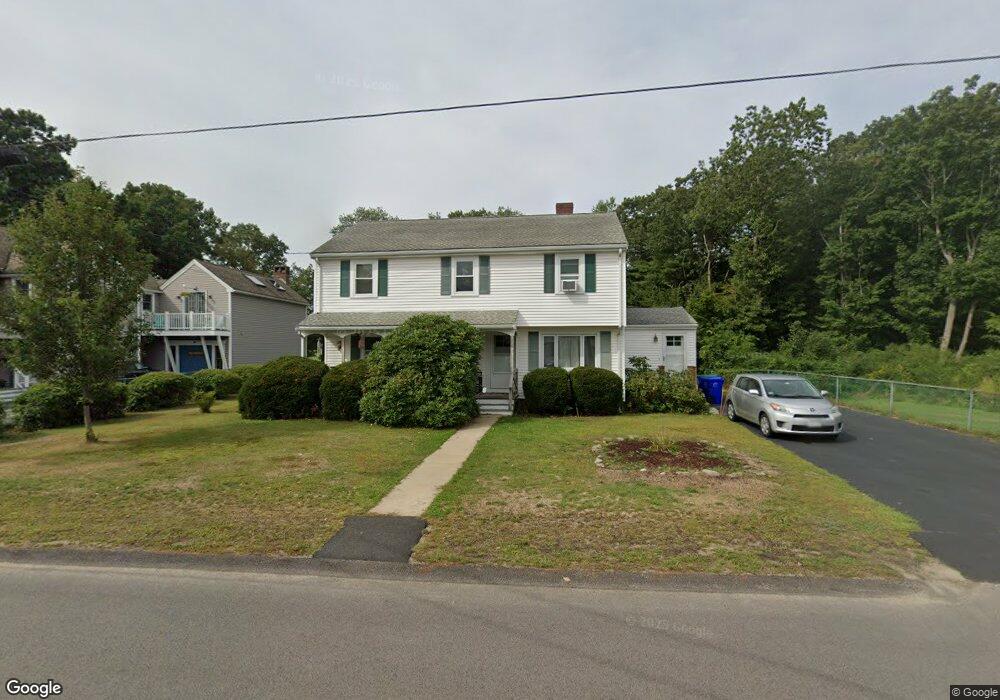
63 Moncrief Rd Rockland, MA 02370
Estimated Value: $585,000 - $669,000
3
Beds
3
Baths
2,008
Sq Ft
$312/Sq Ft
Est. Value
About This Home
This home is located at 63 Moncrief Rd, Rockland, MA 02370 and is currently estimated at $626,774, approximately $312 per square foot. 63 Moncrief Rd is a home located in Plymouth County with nearby schools including Rockland Senior High School, Calvary Chapel Academy, and Holy Family Elementary School.
Ownership History
Date
Name
Owned For
Owner Type
Purchase Details
Closed on
Apr 27, 2018
Sold by
Palana James and Palana Miriam B
Bought by
Pamana Ft
Current Estimated Value
Purchase Details
Closed on
Jul 20, 1982
Bought by
Buckley Miriam and Palana James
Create a Home Valuation Report for This Property
The Home Valuation Report is an in-depth analysis detailing your home's value as well as a comparison with similar homes in the area
Home Values in the Area
Average Home Value in this Area
Purchase History
| Date | Buyer | Sale Price | Title Company |
|---|---|---|---|
| Pamana Ft | -- | -- | |
| Buckley Miriam | -- | -- |
Source: Public Records
Mortgage History
| Date | Status | Borrower | Loan Amount |
|---|---|---|---|
| Previous Owner | Buckley Miriam | $89,000 | |
| Previous Owner | Buckley Miriam | $200,000 | |
| Previous Owner | Buckley Miriam | $82,000 |
Source: Public Records
Tax History Compared to Growth
Tax History
| Year | Tax Paid | Tax Assessment Tax Assessment Total Assessment is a certain percentage of the fair market value that is determined by local assessors to be the total taxable value of land and additions on the property. | Land | Improvement |
|---|---|---|---|---|
| 2025 | $8,116 | $593,700 | $258,000 | $335,700 |
| 2024 | $7,934 | $564,300 | $243,400 | $320,900 |
| 2023 | $7,735 | $508,200 | $213,500 | $294,700 |
| 2022 | $7,465 | $445,700 | $185,700 | $260,000 |
| 2021 | $7,014 | $405,900 | $168,800 | $237,100 |
| 2020 | $6,816 | $389,500 | $160,800 | $228,700 |
| 2019 | $6,557 | $365,900 | $153,100 | $212,800 |
| 2018 | $6,379 | $350,100 | $160,100 | $190,000 |
| 2017 | $6,156 | $333,100 | $160,100 | $173,000 |
| 2016 | $5,963 | $322,500 | $153,900 | $168,600 |
| 2015 | $5,694 | $299,200 | $143,900 | $155,300 |
| 2014 | $5,335 | $290,900 | $141,100 | $149,800 |
Source: Public Records
Map
Nearby Homes