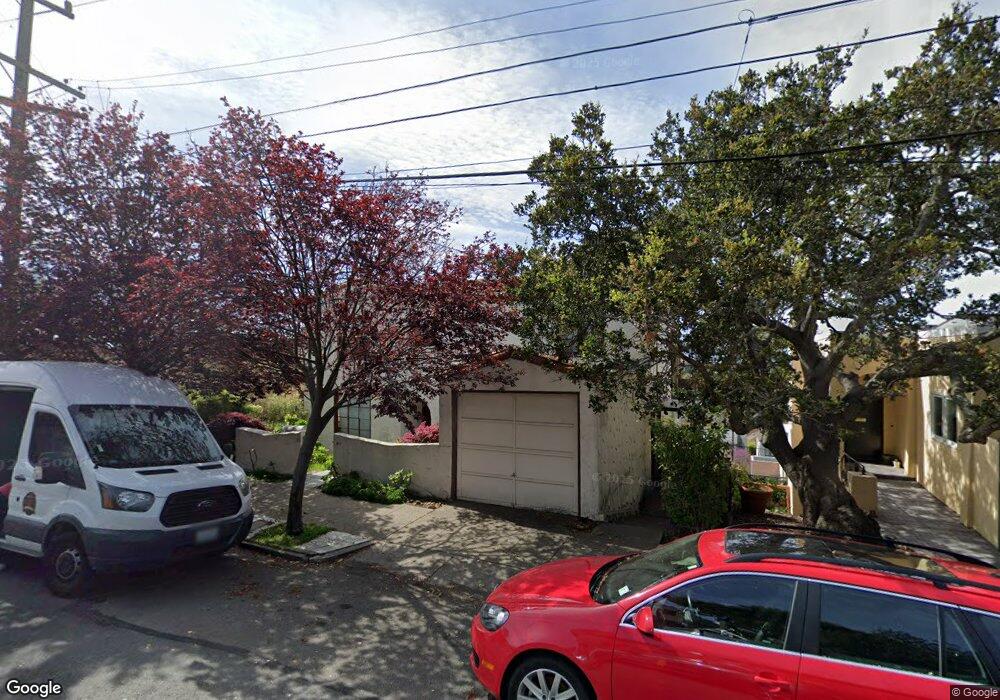
630 San Miguel Ave Berkeley, CA 94707
Thousand Oaks NeighborhoodEstimated Value: $1,534,351 - $2,359,000
3
Beds
3
Baths
1,696
Sq Ft
$1,062/Sq Ft
Est. Value
About This Home
This home is located at 630 San Miguel Ave, Berkeley, CA 94707 and is currently estimated at $1,801,338, approximately $1,062 per square foot. 630 San Miguel Ave is a home located in Alameda County with nearby schools including Thousand Oaks Elementary School, Ruth Acty Elementary, and Berkeley Arts Magnet at Whittier School.
Ownership History
Date
Name
Owned For
Owner Type
Purchase Details
Closed on
Sep 3, 2010
Sold by
Budner Bruce A and Budner Maria P
Bought by
Onoyama Smith Carl Matthew and Onoyama Smith Misa
Current Estimated Value
Home Financials for this Owner
Home Financials are based on the most recent Mortgage that was taken out on this home.
Original Mortgage
$729,750
Outstanding Balance
$482,121
Interest Rate
4.45%
Mortgage Type
New Conventional
Estimated Equity
$1,319,217
Purchase Details
Closed on
Feb 17, 2005
Sold by
Budner Bruce A and Budner Maria P
Bought by
Budner Bruce A and Budner Maria P
Purchase Details
Closed on
Apr 8, 2003
Sold by
Davis Frederic E
Bought by
Budner Bruce A and Budner Maria P
Home Financials for this Owner
Home Financials are based on the most recent Mortgage that was taken out on this home.
Original Mortgage
$322,700
Interest Rate
5.73%
Create a Home Valuation Report for This Property
The Home Valuation Report is an in-depth analysis detailing your home's value as well as a comparison with similar homes in the area
Home Values in the Area
Average Home Value in this Area
Purchase History
| Date | Buyer | Sale Price | Title Company |
|---|---|---|---|
| Onoyama Smith Carl Matthew | $1,050,000 | Chicago Title Company | |
| Budner Bruce A | -- | -- | |
| Budner Bruce A | $982,000 | Old Republic Title Company |
Source: Public Records
Mortgage History
| Date | Status | Borrower | Loan Amount |
|---|---|---|---|
| Open | Onoyama Smith Carl Matthew | $729,750 | |
| Previous Owner | Budner Bruce A | $322,700 |
Source: Public Records
Tax History Compared to Growth
Tax History
| Year | Tax Paid | Tax Assessment Tax Assessment Total Assessment is a certain percentage of the fair market value that is determined by local assessors to be the total taxable value of land and additions on the property. | Land | Improvement |
|---|---|---|---|---|
| 2025 | $19,551 | $1,338,154 | $403,546 | $941,608 |
| 2024 | $19,551 | $1,311,788 | $395,636 | $923,152 |
| 2023 | $19,157 | $1,292,937 | $387,881 | $905,056 |
| 2022 | $18,837 | $1,260,591 | $380,277 | $887,314 |
| 2021 | $18,898 | $1,235,737 | $372,821 | $869,916 |
| 2020 | $17,927 | $1,230,001 | $369,000 | $861,001 |
| 2019 | $17,273 | $1,205,893 | $361,768 | $844,125 |
| 2018 | $16,999 | $1,182,257 | $354,677 | $827,580 |
| 2017 | $16,424 | $1,159,084 | $347,725 | $811,359 |
| 2016 | $15,938 | $1,136,361 | $340,908 | $795,453 |
| 2015 | $15,732 | $1,119,300 | $335,790 | $783,510 |
| 2014 | $14,412 | $999,000 | $299,700 | $699,300 |
Source: Public Records
Map
Nearby Homes
- 628 San Miguel Ave
- 636 Santa Rosa Ave
- 624 San Miguel Ave
- 640 Santa Rosa Ave
- 651 Vincente Ave
- 649 Vincente Ave
- 655 Vincente Ave
- 643 Vincente Ave
- 663 Vincente Ave
- 629 Santa Rosa Ave
- 620 San Miguel Ave
- 642 Santa Rosa Ave
- 635 Santa Rosa Ave
- 627 Santa Rosa Ave
- 639 Santa Rosa Ave
- 639 Vincente Ave
- 667 Vincente Ave
- 620 Santa Rosa Ave
- 616 San Miguel Ave
- 646 Santa Rosa Ave