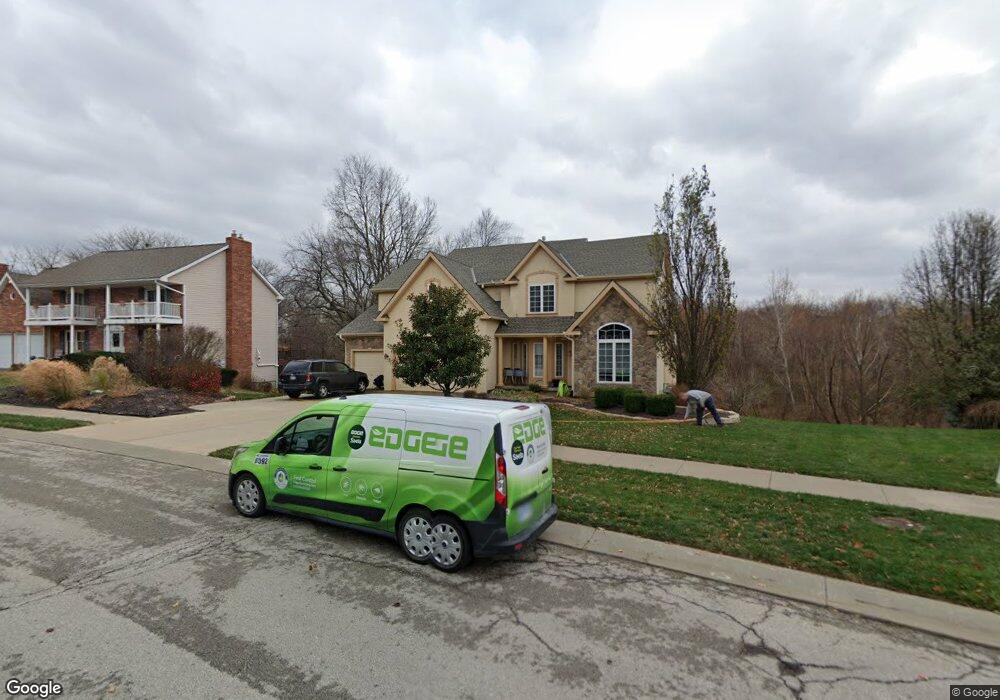
631 Willow St Lansing, KS 66043
Estimated Value: $510,016 - $551,000
4
Beds
5
Baths
3,209
Sq Ft
$164/Sq Ft
Est. Value
About This Home
This home is located at 631 Willow St, Lansing, KS 66043 and is currently estimated at $526,504, approximately $164 per square foot. 631 Willow St is a home located in Leavenworth County with nearby schools including Lansing Elementary School, Lansing Middle 6-8, and Lansing High 9-12.
Ownership History
Date
Name
Owned For
Owner Type
Purchase Details
Closed on
Aug 20, 2009
Sold by
Bernard Joseph E
Bought by
Chesne Bruce D and Chesne Joyce K
Current Estimated Value
Home Financials for this Owner
Home Financials are based on the most recent Mortgage that was taken out on this home.
Original Mortgage
$441,750
Outstanding Balance
$287,729
Interest Rate
5.19%
Mortgage Type
VA
Estimated Equity
$238,775
Create a Home Valuation Report for This Property
The Home Valuation Report is an in-depth analysis detailing your home's value as well as a comparison with similar homes in the area
Home Values in the Area
Average Home Value in this Area
Purchase History
| Date | Buyer | Sale Price | Title Company |
|---|---|---|---|
| Chesne Bruce D | $432,915 | Tri-County Title & Abstract Ll |
Source: Public Records
Mortgage History
| Date | Status | Borrower | Loan Amount |
|---|---|---|---|
| Open | Chesne Bruce D | $441,750 |
Source: Public Records
Tax History
| Year | Tax Paid | Tax Assessment Tax Assessment Total Assessment is a certain percentage of the fair market value that is determined by local assessors to be the total taxable value of land and additions on the property. | Land | Improvement |
|---|---|---|---|---|
| 2025 | $7,568 | $57,851 | $5,963 | $51,888 |
| 2024 | $7,208 | $55,626 | $5,963 | $49,663 |
| 2023 | $7,208 | $55,108 | $5,963 | $49,145 |
| 2022 | $7,085 | $51,198 | $5,062 | $46,136 |
| 2021 | $6,782 | $46,920 | $5,062 | $41,858 |
| 2020 | $6,497 | $44,240 | $5,062 | $39,178 |
| 2019 | $6,506 | $44,240 | $5,062 | $39,178 |
| 2018 | $6,503 | $44,240 | $5,062 | $39,178 |
| 2017 | $6,395 | $43,415 | $5,062 | $38,353 |
| 2016 | $6,505 | $44,134 | $5,062 | $39,072 |
| 2015 | $6,486 | $44,134 | $5,062 | $39,072 |
| 2014 | $6,354 | $44,134 | $5,062 | $39,072 |
Source: Public Records
Map
Nearby Homes
- 111 Southfork Rd
- 875 Clearview Dr
- 189 Canyon View Dr
- 712 Rock Creek Dr
- 1322 Rock Creek Ct
- 898 Clearview Dr
- 1221 S Desoto Rd
- 922 Southfork St
- 1313 Stone Ln
- 811 4-H Rd
- 24431 139th St
- 13965 Mc Intyre Rd
- 13788 McIntyre1 Rd
- 13788 Mcintyre Rd
- 13788 McIntyre2 Rd
- 26731 147th St
- 503 S 1st St
- 202 S Main St
- 124 S Main St
- 215 E Mary St
Your Personal Tour Guide
Ask me questions while you tour the home.