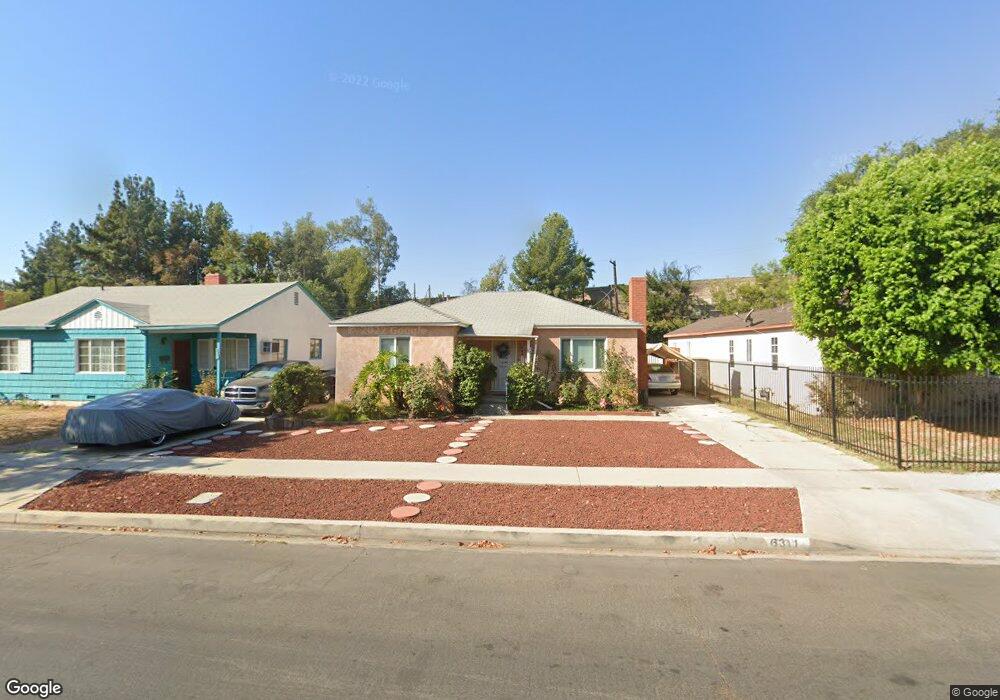
6311 Blucher Ave van Nuys, CA 91411
Estimated Value: $860,514 - $1,137,000
3
Beds
2
Baths
1,497
Sq Ft
$663/Sq Ft
Est. Value
About This Home
This home is located at 6311 Blucher Ave, van Nuys, CA 91411 and is currently estimated at $993,129, approximately $663 per square foot. 6311 Blucher Ave is a home located in Los Angeles County with nearby schools including Sylvan Park Elementary, Van Nuys High School, and Valley School.
Ownership History
Date
Name
Owned For
Owner Type
Purchase Details
Closed on
Feb 11, 2013
Sold by
Atwood Myrna V
Bought by
Atwood Myrna and Myrna V Atwood Trust
Current Estimated Value
Purchase Details
Closed on
May 3, 2011
Sold by
Atwood Myrna V
Bought by
Atwood Myrna
Purchase Details
Closed on
Apr 12, 2004
Sold by
Atwood Robert G
Bought by
Atwood Robert G and Atwood Myrna
Purchase Details
Closed on
Oct 27, 2000
Sold by
Atwood Robert G
Bought by
Atwood Robert G and Atwood Myrna
Purchase Details
Closed on
Aug 19, 1994
Sold by
Home Svgs Of America Fsb
Bought by
Atwood Robert Glen
Home Financials for this Owner
Home Financials are based on the most recent Mortgage that was taken out on this home.
Original Mortgage
$63,000
Interest Rate
8.37%
Purchase Details
Closed on
Mar 21, 1994
Sold by
Serrano Reconveyance Company
Bought by
Home Svgs Of America Fsb
Create a Home Valuation Report for This Property
The Home Valuation Report is an in-depth analysis detailing your home's value as well as a comparison with similar homes in the area
Home Values in the Area
Average Home Value in this Area
Purchase History
| Date | Buyer | Sale Price | Title Company |
|---|---|---|---|
| Atwood Myrna | -- | None Available | |
| Atwood Myrna | -- | None Available | |
| Atwood Robert G | -- | -- | |
| Atwood Robert G | -- | -- | |
| Atwood Robert Glen | $108,000 | First American Title Co | |
| Home Svgs Of America Fsb | $165,177 | Investors Title |
Source: Public Records
Mortgage History
| Date | Status | Borrower | Loan Amount |
|---|---|---|---|
| Previous Owner | Atwood Robert Glen | $63,000 |
Source: Public Records
Tax History
| Year | Tax Paid | Tax Assessment Tax Assessment Total Assessment is a certain percentage of the fair market value that is determined by local assessors to be the total taxable value of land and additions on the property. | Land | Improvement |
|---|---|---|---|---|
| 2025 | $3,386 | $266,273 | $116,051 | $150,222 |
| 2024 | $3,386 | $261,053 | $113,776 | $147,277 |
| 2023 | $3,324 | $255,936 | $111,546 | $144,390 |
| 2022 | $3,175 | $250,918 | $109,359 | $141,559 |
| 2021 | $3,130 | $245,999 | $107,215 | $138,784 |
| 2019 | $3,038 | $238,704 | $104,036 | $134,668 |
| 2018 | $2,938 | $234,025 | $101,997 | $132,028 |
| 2016 | $2,794 | $224,940 | $98,038 | $126,902 |
| 2015 | $2,755 | $221,562 | $96,566 | $124,996 |
| 2014 | $2,770 | $225,410 | $94,675 | $130,735 |
Source: Public Records
Map
Nearby Homes
- 15525 Sylvan St
- 6539 Blucher Ave
- 6355 Peach Ave
- 6552 Aqueduct Ave
- 6551 Whitman Ave
- 6448 Peach Ave
- 6615 Orion Ave
- 6616 Langdon Ave
- 6631 Densmore Ave
- 15933 Haynes St
- 6331 Columbus Ave
- 6649 Sepulveda Blvd
- 6628 Gaviota Ave
- 15148 Domino St
- 6537 Columbus Ave
- 6648 Gaviota Ave
- 6707 N Sepulveda Blvd
- 6819 Chisholm Ave
- 15445 Vanowen St
- 15112 Domino St
- 6315 Blucher Ave
- 6305 Blucher Ave
- 6301 Blucher Ave
- 6269 Blucher Ave
- 6310 Blucher Ave
- 6325 Blucher Ave
- 6326 Blucher Ave
- 6265 Blucher Ave
- 15546 Friar St
- 15514 Friar St
- 6329 Blucher Ave
- 15540 Friar St
- 15519 Sylvan St
- 6259 Blucher Ave
- 15508 Friar St
- 15522 Sylvan St
- 15502 Friar St
- 6253 Blucher Ave
- 15515 Sylvan St
- 6340 Blucher Ave