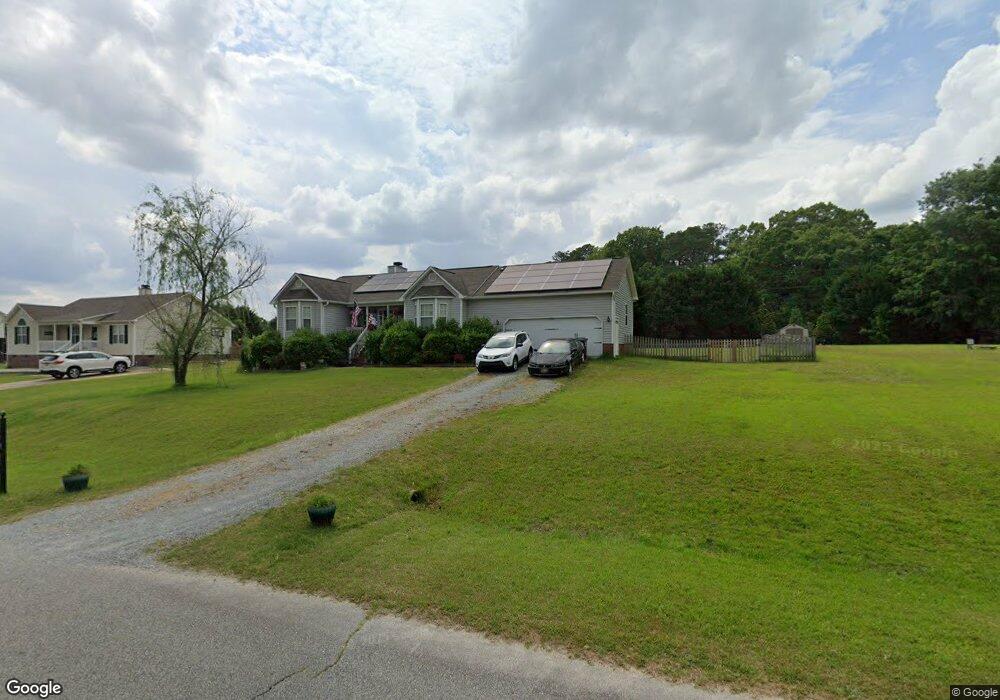
6328 Bridgemont Ln Willow Spring, NC 27592
Estimated Value: $333,000 - $358,000
3
Beds
2
Baths
1,559
Sq Ft
$222/Sq Ft
Est. Value
About This Home
This home is located at 6328 Bridgemont Ln, Willow Spring, NC 27592 and is currently estimated at $345,661, approximately $221 per square foot. 6328 Bridgemont Ln is a home located in Wake County with nearby schools including Banks Road Elementary School and West Lake Middle.
Ownership History
Date
Name
Owned For
Owner Type
Purchase Details
Closed on
Jun 1, 2018
Sold by
Nc Land Investments Llc
Bought by
Cheek Garrett and Cheek Stacy
Current Estimated Value
Home Financials for this Owner
Home Financials are based on the most recent Mortgage that was taken out on this home.
Original Mortgage
$294,950
Outstanding Balance
$255,426
Interest Rate
4.56%
Estimated Equity
$90,235
Purchase Details
Closed on
May 26, 2005
Sold by
Dehaan Jeffrey and Dehaan Mackenzie
Bought by
Cheek Garrett R and Carraway Stacy B
Home Financials for this Owner
Home Financials are based on the most recent Mortgage that was taken out on this home.
Original Mortgage
$115,920
Interest Rate
6.25%
Mortgage Type
Purchase Money Mortgage
Purchase Details
Closed on
Sep 29, 2000
Sold by
Comfort Homes Inc
Bought by
Dehaan Jeffrey and Dehaan Mackenzie
Home Financials for this Owner
Home Financials are based on the most recent Mortgage that was taken out on this home.
Original Mortgage
$132,900
Interest Rate
7.92%
Create a Home Valuation Report for This Property
The Home Valuation Report is an in-depth analysis detailing your home's value as well as a comparison with similar homes in the area
Home Values in the Area
Average Home Value in this Area
Purchase History
| Date | Buyer | Sale Price | Title Company |
|---|---|---|---|
| Cheek Garrett | -- | -- | |
| Cheek Garrett R | $145,000 | -- | |
| Dehaan Jeffrey | $140,000 | -- |
Source: Public Records
Mortgage History
| Date | Status | Borrower | Loan Amount |
|---|---|---|---|
| Open | Cheek Garrett | $294,950 | |
| Closed | Cheek Garrett | -- | |
| Previous Owner | Cheek Garrett R | $115,920 | |
| Previous Owner | Cheek Garrett R | $28,980 | |
| Previous Owner | Cheek Garrett | $134,200 | |
| Previous Owner | Cheek Garrett | $133,000 | |
| Previous Owner | Dehaan Jeffrey | $132,900 |
Source: Public Records
Tax History
| Year | Tax Paid | Tax Assessment Tax Assessment Total Assessment is a certain percentage of the fair market value that is determined by local assessors to be the total taxable value of land and additions on the property. | Land | Improvement |
|---|---|---|---|---|
| 2025 | $2,256 | $349,578 | $90,000 | $259,578 |
| 2024 | $2,191 | $349,578 | $90,000 | $259,578 |
| 2023 | $1,710 | $216,736 | $35,000 | $181,736 |
| 2022 | $1,585 | $216,736 | $35,000 | $181,736 |
| 2021 | $1,543 | $216,736 | $35,000 | $181,736 |
| 2020 | $1,518 | $216,736 | $35,000 | $181,736 |
| 2019 | $1,356 | $163,590 | $32,000 | $131,590 |
| 2018 | $1,248 | $163,590 | $32,000 | $131,590 |
| 2017 | $1,183 | $163,590 | $32,000 | $131,590 |
| 2016 | $1,159 | $163,590 | $32,000 | $131,590 |
| 2015 | $1,151 | $162,826 | $30,000 | $132,826 |
| 2014 | $1,091 | $162,826 | $30,000 | $132,826 |
Source: Public Records
Map
Nearby Homes
- 1636 Middle Ridge Dr
- 6304 Walnut Glen Dr
- 6512 Blalock Forest Dr
- 1425 Tawny View Ln
- 1133 Farmers Branch Rd
- 1417 Pleasant Quail Ct
- 1305 Tawny View Ln
- 821 Comice Pear Way
- 3748 Norman Blalock Rd
- 824 Comice Pear Way
- 830 Comice Pear Way
- 841 Comice Pear Way
- 837 Comice Pear Way
- 905 Comice Pear Way
- 829 Comice Pear Way
- 812 Comice Pear Way
- 1104 Taylor Farm Rd
- 2015 Stone Pasture Rd
- 840 Comice Pear Way
- 833 Comice Pear Way
- 6332 Bridgemont Ln
- 6324 Bridgemont Ln
- 6400 Bridgemont Ln
- 6320 Bridgemont Ln
- 6329 Bridgemont Ln
- 6325 Bridgemont Ln
- 6436 Silver Spring Ct
- 6333 Bridgemont Ln
- 6321 Bridgemont Ln
- 6437 Silver Spring Ct
- 6405 Bridgemont Ln
- 6316 Bridgemont Ln
- 6404 Bridgemont Ln
- 6432 Silver Spring Ct
- 6317 Bridgemont Ln
- 6433 Silver Spring Ct
- 6313 Bridgemont Ln
- 6424 Silver Spring Ct
- 6312 Bridgemont Ln
- 6429 Silver Spring Ct
Your Personal Tour Guide
Ask me questions while you tour the home.