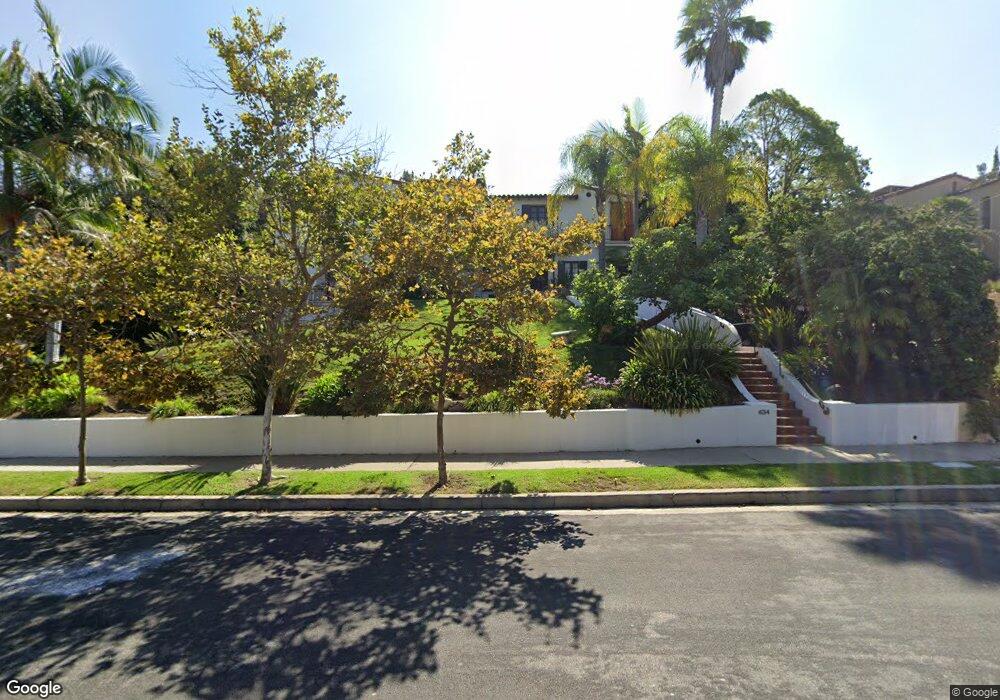
634 S June St Los Angeles, CA 90005
Hancock Park NeighborhoodEstimated Value: $5,556,000 - $7,833,269
7
Beds
7
Baths
7,069
Sq Ft
$942/Sq Ft
Est. Value
About This Home
This home is located at 634 S June St, Los Angeles, CA 90005 and is currently estimated at $6,661,817, approximately $942 per square foot. 634 S June St is a home located in Los Angeles County with nearby schools including Third Street Elementary School, John Burroughs Middle School, and Fairfax High School.
Ownership History
Date
Name
Owned For
Owner Type
Purchase Details
Closed on
Nov 21, 2019
Sold by
Nankivell Paul H and Rothschild Loren
Bought by
Ingrassia Richard M and Azar Richard F
Current Estimated Value
Home Financials for this Owner
Home Financials are based on the most recent Mortgage that was taken out on this home.
Original Mortgage
$2,691,000
Outstanding Balance
$2,350,580
Interest Rate
3.25%
Estimated Equity
$4,311,237
Create a Home Valuation Report for This Property
The Home Valuation Report is an in-depth analysis detailing your home's value as well as a comparison with similar homes in the area
Home Values in the Area
Average Home Value in this Area
Purchase History
| Date | Buyer | Sale Price | Title Company |
|---|---|---|---|
| Ingrassia Richard M | $4,485,000 | Equity Title Company |
Source: Public Records
Mortgage History
| Date | Status | Borrower | Loan Amount |
|---|---|---|---|
| Open | Ingrassia Richard M | $2,691,000 |
Source: Public Records
Tax History Compared to Growth
Tax History
| Year | Tax Paid | Tax Assessment Tax Assessment Total Assessment is a certain percentage of the fair market value that is determined by local assessors to be the total taxable value of land and additions on the property. | Land | Improvement |
|---|---|---|---|---|
| 2025 | $42,561 | $3,515,356 | $2,901,443 | $613,913 |
| 2024 | $42,561 | $3,446,428 | $2,844,552 | $601,876 |
| 2023 | $41,729 | $3,378,852 | $2,788,777 | $590,075 |
| 2022 | $55,039 | $4,622,093 | $3,606,985 | $1,015,108 |
| 2021 | $54,351 | $4,531,464 | $3,536,260 | $995,204 |
| 2019 | $5,381 | $373,964 | $157,563 | $216,401 |
| 2018 | $5,211 | $366,632 | $154,474 | $212,158 |
| 2016 | $4,905 | $352,398 | $148,477 | $203,921 |
| 2015 | $4,839 | $347,105 | $146,247 | $200,858 |
| 2014 | $4,862 | $340,307 | $143,383 | $196,924 |
Source: Public Records
Map
Nearby Homes
- 4925 Wilshire Blvd Unit 103
- 609 S Highland Ave
- 845 S Muirfield Rd
- 248 S Hudson Ave
- 913 S Mullen Ave
- 614 S Orange Dr
- 600 S Orange Dr
- 228 S Hudson Ave
- 107 Fremont Place
- 4477 Wilshire Blvd Unit 304
- 4477 Wilshire Blvd Unit 203
- 4669 W Olympic Blvd
- 4460 Wilshire Blvd Unit 705
- 348 S Orange Dr
- 452 S Sycamore Ave
- 956 S Longwood Ave
- 191 S Hudson Ave
- 632 S Arden Blvd
- 724 S Sycamore Ave
- 4444 Wilshire Blvd Unit 206