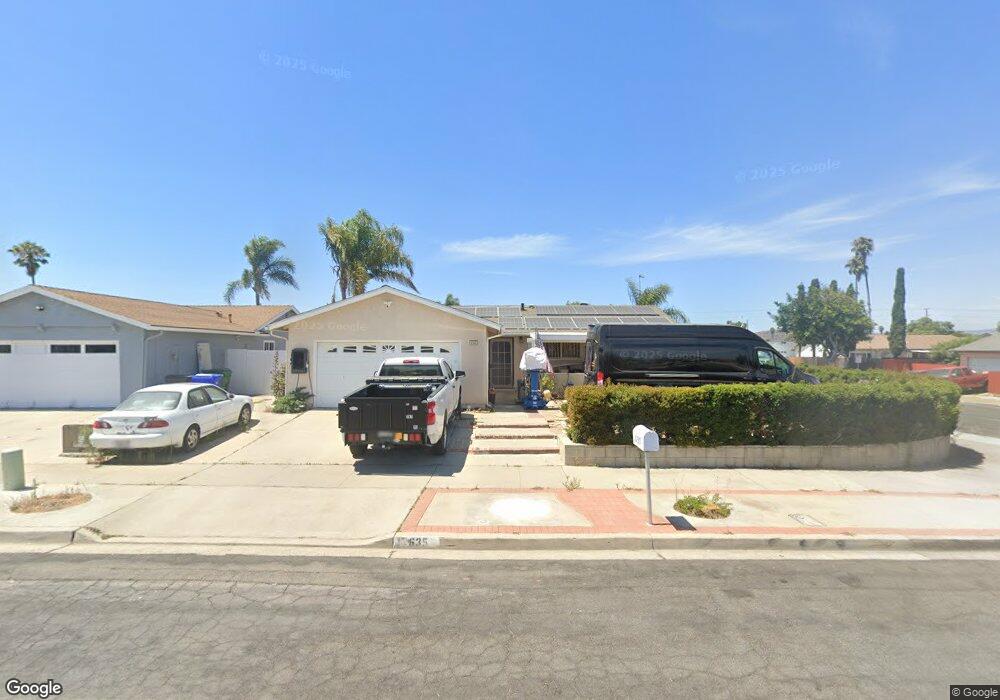
635 Charles Dr Oceanside, CA 92057
North Valley NeighborhoodEstimated Value: $763,549 - $797,000
4
Beds
2
Baths
1,236
Sq Ft
$630/Sq Ft
Est. Value
About This Home
This home is located at 635 Charles Dr, Oceanside, CA 92057 and is currently estimated at $779,137, approximately $630 per square foot. 635 Charles Dr is a home located in San Diego County with nearby schools including Del Rio Elementary School, Cesar Chavez Middle School, and El Camino High School.
Ownership History
Date
Name
Owned For
Owner Type
Purchase Details
Closed on
May 14, 2014
Sold by
Neiswender Leland R and Neiswender Sheridith A
Bought by
Tran Tien N and Dang Huyen T
Current Estimated Value
Home Financials for this Owner
Home Financials are based on the most recent Mortgage that was taken out on this home.
Original Mortgage
$262,500
Outstanding Balance
$192,629
Interest Rate
3.37%
Mortgage Type
Adjustable Rate Mortgage/ARM
Estimated Equity
$586,508
Purchase Details
Closed on
Mar 5, 2001
Sold by
Neiswender Sheridith Ann
Bought by
Neiswender Leland R and Neiswender Sheridith A
Create a Home Valuation Report for This Property
The Home Valuation Report is an in-depth analysis detailing your home's value as well as a comparison with similar homes in the area
Home Values in the Area
Average Home Value in this Area
Purchase History
| Date | Buyer | Sale Price | Title Company |
|---|---|---|---|
| Tran Tien N | $350,000 | Ticor Title | |
| Neiswender Leland R | -- | -- |
Source: Public Records
Mortgage History
| Date | Status | Borrower | Loan Amount |
|---|---|---|---|
| Open | Tran Tien N | $262,500 |
Source: Public Records
Tax History Compared to Growth
Tax History
| Year | Tax Paid | Tax Assessment Tax Assessment Total Assessment is a certain percentage of the fair market value that is determined by local assessors to be the total taxable value of land and additions on the property. | Land | Improvement |
|---|---|---|---|---|
| 2025 | $4,676 | $429,042 | $306,461 | $122,581 |
| 2024 | $4,676 | $420,630 | $300,452 | $120,178 |
| 2023 | $4,531 | $412,383 | $294,561 | $117,822 |
| 2022 | $4,461 | $404,298 | $288,786 | $115,512 |
| 2021 | $4,477 | $396,372 | $283,124 | $113,248 |
| 2020 | $4,338 | $392,308 | $280,221 | $112,087 |
| 2019 | $4,211 | $384,617 | $274,727 | $109,890 |
| 2018 | $4,165 | $377,077 | $269,341 | $107,736 |
| 2017 | $4,087 | $369,684 | $264,060 | $105,624 |
| 2016 | $3,953 | $362,436 | $258,883 | $103,553 |
| 2015 | $3,837 | $356,993 | $254,995 | $101,998 |
| 2014 | $482 | $48,017 | $13,173 | $34,844 |
Source: Public Records
Map
Nearby Homes
- 619 Parker St
- 5045 Los Morros Way Unit 78
- 100 N River Cir Unit 301
- 5010 Los Morros Way Unit 26
- 5037 Los Morros Way Unit 71
- 5110 N River Rd Unit E
- 671 Parker St
- 538 Luna Dr
- 871 Niguel St
- 4847 Concho Cir
- 166 Harrison St
- 1185 Parkview Dr
- 361 Point Windemere Place
- 5510 Giovanni Way
- 1079 Vista Pointe Blvd
- 5166 Via Castilla
- 1116 Bellingham Dr
- 5525 Midori Way
- 5527 Midori Way
- 5528 Midori Way