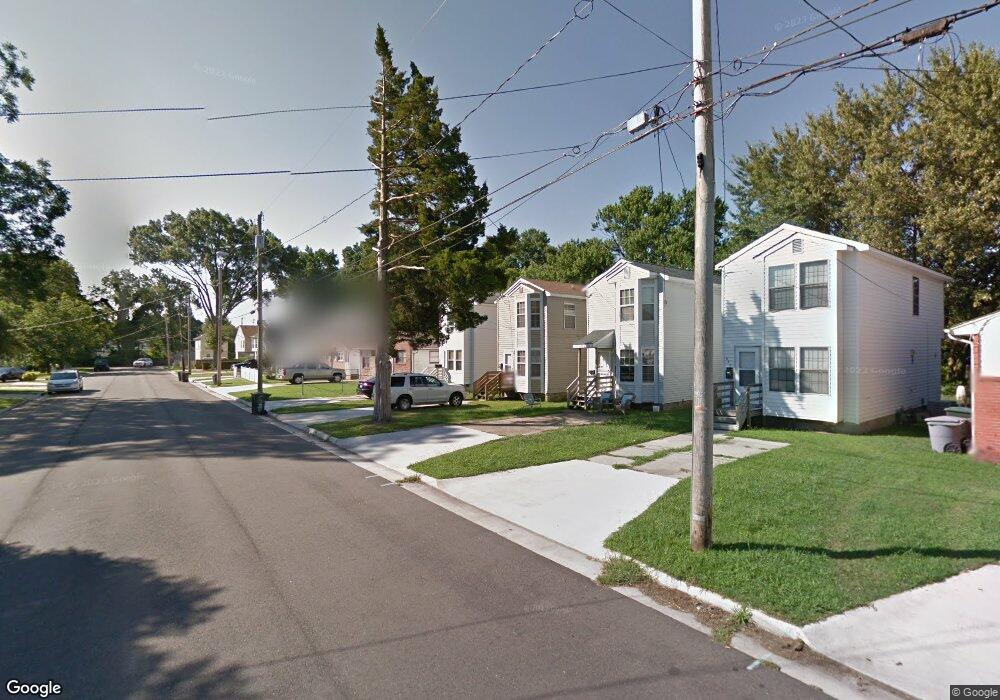
635 Ridgeway Ave Hampton, VA 23661
Wythe NeighborhoodEstimated Value: $223,000 - $262,000
3
Beds
2
Baths
1,149
Sq Ft
$204/Sq Ft
Est. Value
About This Home
This home is located at 635 Ridgeway Ave, Hampton, VA 23661 and is currently estimated at $234,166, approximately $203 per square foot. 635 Ridgeway Ave is a home located in Hampton City with nearby schools including Bassette Elementary School, C. Alton Lindsay Middle School, and Hampton High School.
Ownership History
Date
Name
Owned For
Owner Type
Purchase Details
Closed on
May 27, 2015
Sold by
Keystone Homes Corp
Bought by
Khc Llc
Current Estimated Value
Home Financials for this Owner
Home Financials are based on the most recent Mortgage that was taken out on this home.
Original Mortgage
$810,000
Interest Rate
4.09%
Mortgage Type
New Conventional
Purchase Details
Closed on
May 20, 2014
Sold by
Surety Trustees Llc Sub Tr and Rhoads Nicholas R
Bought by
Keystone Homes Corporation
Purchase Details
Closed on
Jul 3, 2008
Sold by
Hawkins Alex F
Bought by
Rhoads Nicholas R
Home Financials for this Owner
Home Financials are based on the most recent Mortgage that was taken out on this home.
Original Mortgage
$132,692
Interest Rate
6.01%
Mortgage Type
VA
Purchase Details
Closed on
Aug 23, 2005
Sold by
Bailey Kenneth R
Bought by
Hawkins Alex F
Home Financials for this Owner
Home Financials are based on the most recent Mortgage that was taken out on this home.
Original Mortgage
$76,410
Interest Rate
5.81%
Mortgage Type
New Conventional
Create a Home Valuation Report for This Property
The Home Valuation Report is an in-depth analysis detailing your home's value as well as a comparison with similar homes in the area
Home Values in the Area
Average Home Value in this Area
Purchase History
| Date | Buyer | Sale Price | Title Company |
|---|---|---|---|
| Khc Llc | -- | None Available | |
| Keystone Homes Corporation | $69,040 | -- | |
| Rhoads Nicholas R | $129,900 | -- | |
| Hawkins Alex F | $84,900 | -- |
Source: Public Records
Mortgage History
| Date | Status | Borrower | Loan Amount |
|---|---|---|---|
| Previous Owner | Khc Llc | $810,000 | |
| Previous Owner | Rhoads Nicholas R | $132,692 | |
| Previous Owner | Hawkins Alex F | $76,410 |
Source: Public Records
Tax History
| Year | Tax Paid | Tax Assessment Tax Assessment Total Assessment is a certain percentage of the fair market value that is determined by local assessors to be the total taxable value of land and additions on the property. | Land | Improvement |
|---|---|---|---|---|
| 2025 | $2,694 | $235,800 | $23,000 | $212,800 |
| 2024 | $2,405 | $209,100 | $23,000 | $186,100 |
| 2023 | $2,351 | $202,700 | $23,000 | $179,700 |
| 2022 | $1,938 | $164,200 | $20,300 | $143,900 |
| 2021 | $1,582 | $117,100 | $17,600 | $99,500 |
| 2020 | $1,436 | $115,800 | $17,300 | $98,500 |
| 2019 | $1,436 | $115,800 | $17,300 | $98,500 |
| 2018 | $1,509 | $114,100 | $15,600 | $98,500 |
| 2017 | $1,509 | $0 | $0 | $0 |
| 2016 | $1,509 | $114,100 | $0 | $0 |
| 2015 | $1,509 | $0 | $0 | $0 |
| 2014 | $1,499 | $114,100 | $15,600 | $98,500 |
Source: Public Records
Map
Nearby Homes
- 632 Westwood Ave
- 615 Westwood Ave
- 621 Fairland Ave
- 3213 Shell Rd
- 635 Homestead Ave
- 733 Fairland Ave
- 438 Highland Ave
- 429 Shenandoah Rd
- 812 Ridgeway Ave
- 806 Fairland Ave
- 423 Shenandoah Rd
- 714 Milford Ave
- 814 Downing St
- 428 Colonial Ave
- 816 Smith St
- 919 Ridgeway Ave
- 3818 Shell Rd
- 625 Bell St
- 633 Bell St
- 2711 Shell Rd
- 637 Ridgeway Ave
- 633 Ridgeway Ave
- 639 Ridgeway Ave
- 641 Ridgeway Ave
- 631 Ridgeway Ave
- 628 Westwood Ave
- 643 Ridgeway Ave
- 624 Westwood Ave
- 636 Westwood Ave
- 615 Ridgeway Ave
- 647 Ridgeway Ave
- 622 Westwood Ave
- 622 Westwood Ave Unit AVE
- 620 Westwood Ave
- 620 Ridgeway Ave
- 624 Ridgeway Ave
- 640 Westwood Ave
- 611 Ridgeway Ave
- 630 Ridgeway Ave
- 616 Westwood Ave
Your Personal Tour Guide
Ask me questions while you tour the home.