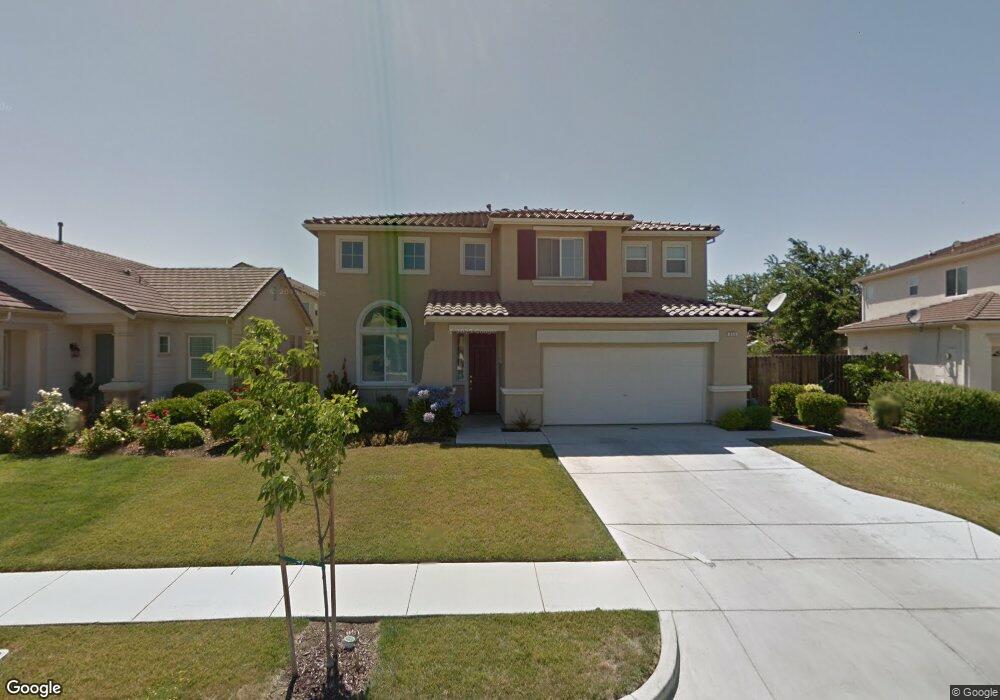
635 Stone Creek Ln Patterson, CA 95363
Estimated Value: $524,927 - $558,000
4
Beds
2
Baths
3,017
Sq Ft
$181/Sq Ft
Est. Value
About This Home
This home is located at 635 Stone Creek Ln, Patterson, CA 95363 and is currently estimated at $546,732, approximately $181 per square foot. 635 Stone Creek Ln is a home located in Stanislaus County with nearby schools including Apricot Valley Elementary School, Creekside Middle School, and Patterson High School.
Ownership History
Date
Name
Owned For
Owner Type
Purchase Details
Closed on
Mar 29, 2011
Sold by
Gupta Nilesh
Bought by
Nilesh Patterson Llc
Current Estimated Value
Purchase Details
Closed on
Dec 8, 2010
Sold by
Gupta Hemant K
Bought by
Gupta Nilesh
Purchase Details
Closed on
Sep 15, 2010
Sold by
Gupta Nalini
Bought by
Gupta Hemant
Purchase Details
Closed on
Apr 15, 2010
Sold by
Pascual Enrico and Pascual Sokimna
Bought by
The Bank Of New York Mellon and The Bank Of New York
Purchase Details
Closed on
Mar 3, 2005
Sold by
Patterson Creekside Meadows Lp
Bought by
Pascual Enrico and Pascual Sokimna
Home Financials for this Owner
Home Financials are based on the most recent Mortgage that was taken out on this home.
Original Mortgage
$251,950
Interest Rate
5.5%
Mortgage Type
Purchase Money Mortgage
Create a Home Valuation Report for This Property
The Home Valuation Report is an in-depth analysis detailing your home's value as well as a comparison with similar homes in the area
Home Values in the Area
Average Home Value in this Area
Purchase History
| Date | Buyer | Sale Price | Title Company |
|---|---|---|---|
| Nilesh Patterson Llc | -- | None Available | |
| Gupta Nilesh | $167,000 | None Available | |
| Gupta Hemant | -- | Landsafe | |
| Gupta Hemant | $167,000 | Landsafe Title | |
| The Bank Of New York Mellon | $161,325 | Landsafe Title | |
| Pascual Enrico | $360,000 | Old Republic |
Source: Public Records
Mortgage History
| Date | Status | Borrower | Loan Amount |
|---|---|---|---|
| Previous Owner | Pascual Enrico | $251,950 | |
| Closed | Pascual Enrico | $108,000 |
Source: Public Records
Tax History
| Year | Tax Paid | Tax Assessment Tax Assessment Total Assessment is a certain percentage of the fair market value that is determined by local assessors to be the total taxable value of land and additions on the property. | Land | Improvement |
|---|---|---|---|---|
| 2025 | $6,080 | $213,941 | $51,240 | $162,701 |
| 2024 | $6,028 | $209,747 | $50,236 | $159,511 |
| 2023 | $6,094 | $205,635 | $49,251 | $156,384 |
| 2022 | $5,880 | $201,604 | $48,286 | $153,318 |
| 2021 | $5,744 | $197,652 | $47,340 | $150,312 |
| 2020 | $5,694 | $195,626 | $46,855 | $148,771 |
| 2019 | $5,608 | $191,791 | $45,937 | $145,854 |
| 2018 | $5,468 | $188,032 | $45,037 | $142,995 |
| 2017 | $5,455 | $184,346 | $44,154 | $140,192 |
| 2016 | $5,404 | $180,733 | $43,289 | $137,444 |
| 2015 | $5,324 | $178,019 | $42,639 | $135,380 |
| 2014 | $5,242 | $174,533 | $41,804 | $132,729 |
Source: Public Records
Map
Nearby Homes
- 1407 Dylan Creek Dr
- 612 Beck Creek Ln
- 1459 Mesa Creek Dr
- 432 Meadow Creek Dr
- 1314 Sutter Creek Ct
- 1419 Nubian St
- 433 Sanderling Dr
- 216 Barros St
- 158 Charbray Ct
- 409 Osprey Dr
- 642 Wanzia Ct
- 1413 Angus St
- 1127 Kestrel Dr
- 1132 Marsh Wren Ct
- 445 M St
- 147 Ivy Ave
- 1265 Fawn Lily Dr
- 140 Ivy Ave Unit A5
- 140 Ivy Ave Unit 39
- 701 N 3rd St
- 641 Stone Creek Ln
- 629 Stone Creek Ln
- 636 Lodge Creek Ln
- 630 Lodge Creek Ln
- 647 Stone Creek Ln
- 623 Stone Creek Ln
- 1408 Dylan Creek Dr
- 636 Stone Creek Ln
- 630 Stone Creek Ln
- 1419 Carly Creek Dr
- 624 Lodge Creek Ln
- 642 Stone Creek Ln
- 1412 Dylan Creek Dr
- 624 Stone Creek Ln
- 648 Stone Creek Ln
- 1423 Carly Creek Dr
- 1424 Carly Creek Dr
- 635 Pine Creek Ln
- 629 Pine Creek Ln
Your Personal Tour Guide
Ask me questions while you tour the home.