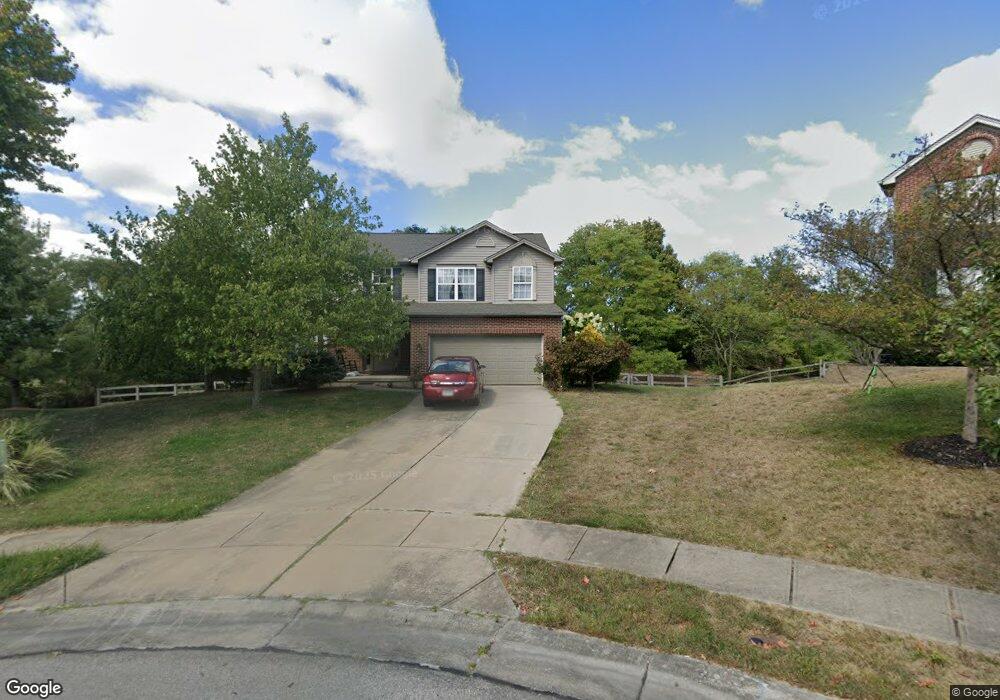
6353 Markham Ct Independence, KY 41051
Estimated Value: $374,101 - $419,000
4
Beds
3
Baths
2,375
Sq Ft
$167/Sq Ft
Est. Value
About This Home
This home is located at 6353 Markham Ct, Independence, KY 41051 and is currently estimated at $395,775, approximately $166 per square foot. 6353 Markham Ct is a home located in Kenton County with nearby schools including Ryland Heights Elementary School, Woodland Middle School, and Scott High School.
Ownership History
Date
Name
Owned For
Owner Type
Purchase Details
Closed on
Jun 26, 2016
Sold by
Kennedy Greta
Bought by
Kennedy Greta
Current Estimated Value
Purchase Details
Closed on
Nov 9, 2011
Sold by
Bowlin Michael L and Bowlin Maryann C
Bought by
Kennedy William D
Home Financials for this Owner
Home Financials are based on the most recent Mortgage that was taken out on this home.
Original Mortgage
$125,000
Outstanding Balance
$85,525
Interest Rate
4.09%
Mortgage Type
New Conventional
Estimated Equity
$310,250
Purchase Details
Closed on
Mar 31, 2006
Sold by
Dixon Builders I Llc
Bought by
Bowlin Michael L and Bowlin Maryann C
Home Financials for this Owner
Home Financials are based on the most recent Mortgage that was taken out on this home.
Original Mortgage
$181,780
Interest Rate
6.23%
Mortgage Type
Fannie Mae Freddie Mac
Purchase Details
Closed on
Nov 30, 2004
Sold by
Wwb Development Group Llc
Bought by
Dixon Builders I Llc
Create a Home Valuation Report for This Property
The Home Valuation Report is an in-depth analysis detailing your home's value as well as a comparison with similar homes in the area
Home Values in the Area
Average Home Value in this Area
Purchase History
| Date | Buyer | Sale Price | Title Company |
|---|---|---|---|
| Kennedy Greta | -- | Attorney | |
| Kennedy William D | $185,000 | None Available | |
| Bowlin Michael L | $201,983 | None Available | |
| Dixon Builders I Llc | $190,000 | -- |
Source: Public Records
Mortgage History
| Date | Status | Borrower | Loan Amount |
|---|---|---|---|
| Open | Kennedy William D | $125,000 | |
| Previous Owner | Bowlin Michael L | $181,780 |
Source: Public Records
Tax History Compared to Growth
Tax History
| Year | Tax Paid | Tax Assessment Tax Assessment Total Assessment is a certain percentage of the fair market value that is determined by local assessors to be the total taxable value of land and additions on the property. | Land | Improvement |
|---|---|---|---|---|
| 2024 | $2,094 | $217,300 | $40,000 | $177,300 |
| 2023 | $2,157 | $217,300 | $40,000 | $177,300 |
| 2022 | $2,293 | $217,300 | $40,000 | $177,300 |
| 2021 | $2,327 | $217,300 | $40,000 | $177,300 |
| 2020 | $1,971 | $185,000 | $40,000 | $145,000 |
| 2019 | $1,976 | $185,000 | $40,000 | $145,000 |
| 2018 | $2,009 | $185,000 | $40,000 | $145,000 |
| 2017 | $1,954 | $185,000 | $40,000 | $145,000 |
| 2015 | $1,904 | $185,000 | $38,000 | $147,000 |
| 2014 | $1,889 | $185,000 | $38,000 | $147,000 |
Source: Public Records
Map
Nearby Homes
- 964 Stablewatch Dr
- 6314 Filly Ct
- 748 Stablewatch Dr
- 6339 Arabian Dr
- BRADSHAW Plan at Woods at Lakefield
- TRENT Plan at Woods at Lakefield
- CLARKSON Plan at Woods at Lakefield
- GARRETT Plan at Woods at Lakefield
- EATON Plan at Woods at Lakefield
- THORPE Plan at Woods at Lakefield
- FINNEGAN Plan at Woods at Lakefield
- 6388 Alexandra Ct
- 907 Stablewatch Dr
- 6256 Woodsgrove Ct
- 951 Stablewatch Dr
- 18 Greenmere Cir
- 794 Stonybrook Ct
- 789 Stonybrook Ct
- Greenbriar Plan at Willow Green - Maple Street Collection
- Jensen Plan at Willow Green - Maple Street Collection
- 6349 Markham Ct
- 6358 Markham Ct
- 806 Windmill Dr
- 802 Windmill Dr
- 6350 Stonemill Dr
- 6345 Markham Ct
- 6354 Markham Ct
- 6354 Stonemill Dr
- 6354 Stonemill Dr Unit 125
- 6346 Stonemill Dr
- 798 Windmill Dr
- 798 Windmill Dr Unit 128
- 6350 Markham Ct
- 6342 Stonemill Dr
- 6342 Stonemill Dr Unit 122
- 6341 Markham Ct
- 6346 Markham Ct
- 794 Windmill Dr
- 6342 Markham Ct
- 6342 Markham Ct Unit 92