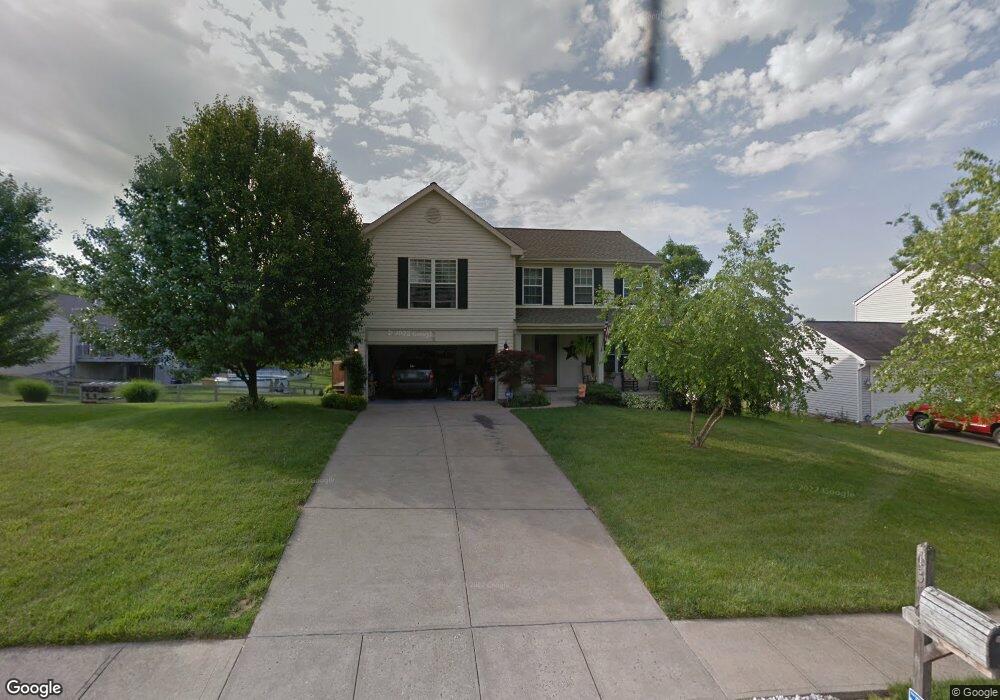
6354 Fieldsteade Dr Independence, KY 41051
Estimated Value: $334,000 - $358,000
4
Beds
3
Baths
1,984
Sq Ft
$174/Sq Ft
Est. Value
About This Home
This home is located at 6354 Fieldsteade Dr, Independence, KY 41051 and is currently estimated at $345,033, approximately $173 per square foot. 6354 Fieldsteade Dr is a home located in Kenton County with nearby schools including White's Tower Elementary School, Woodland Middle School, and Scott High School.
Ownership History
Date
Name
Owned For
Owner Type
Purchase Details
Closed on
Jun 14, 2007
Sold by
Whitaker Susan J and Pulsfort Patricia
Bought by
Whitaker Susan J and Whitaker Darrell D
Current Estimated Value
Home Financials for this Owner
Home Financials are based on the most recent Mortgage that was taken out on this home.
Original Mortgage
$174,250
Outstanding Balance
$107,543
Interest Rate
6.35%
Mortgage Type
Stand Alone Refi Refinance Of Original Loan
Estimated Equity
$237,490
Purchase Details
Closed on
Mar 31, 2004
Sold by
Cahill Camie
Bought by
Whitaker Susan J and Pulsfort Patricia
Purchase Details
Closed on
Mar 29, 1999
Sold by
Drees Co
Bought by
Cahill Andrew J and Cahill Cami
Home Financials for this Owner
Home Financials are based on the most recent Mortgage that was taken out on this home.
Original Mortgage
$125,700
Interest Rate
9.13%
Mortgage Type
New Conventional
Create a Home Valuation Report for This Property
The Home Valuation Report is an in-depth analysis detailing your home's value as well as a comparison with similar homes in the area
Home Values in the Area
Average Home Value in this Area
Purchase History
| Date | Buyer | Sale Price | Title Company |
|---|---|---|---|
| Whitaker Susan J | -- | Vintage Title Agency Inc | |
| Whitaker Susan J | $148,000 | -- | |
| Cahill Andrew J | $139,750 | -- |
Source: Public Records
Mortgage History
| Date | Status | Borrower | Loan Amount |
|---|---|---|---|
| Open | Whitaker Susan J | $174,250 | |
| Previous Owner | Cahill Andrew J | $125,700 |
Source: Public Records
Tax History Compared to Growth
Tax History
| Year | Tax Paid | Tax Assessment Tax Assessment Total Assessment is a certain percentage of the fair market value that is determined by local assessors to be the total taxable value of land and additions on the property. | Land | Improvement |
|---|---|---|---|---|
| 2024 | $2,374 | $193,800 | $35,000 | $158,800 |
| 2023 | $2,446 | $193,800 | $35,000 | $158,800 |
| 2022 | $2,506 | $193,800 | $35,000 | $158,800 |
| 2021 | $2,543 | $193,800 | $35,000 | $158,800 |
| 2020 | $2,222 | $165,000 | $35,000 | $130,000 |
| 2019 | $2,228 | $165,000 | $35,000 | $130,000 |
| 2018 | $2,240 | $165,000 | $35,000 | $130,000 |
| 2017 | $2,179 | $165,000 | $35,000 | $130,000 |
| 2015 | $1,903 | $148,000 | $30,000 | $118,000 |
| 2014 | $1,876 | $148,000 | $30,000 | $118,000 |
Source: Public Records
Map
Nearby Homes
- 748 Stablewatch Dr
- 6314 Filly Ct
- 964 Stablewatch Dr
- BRADSHAW Plan at Woods at Lakefield
- TRENT Plan at Woods at Lakefield
- CLARKSON Plan at Woods at Lakefield
- GARRETT Plan at Woods at Lakefield
- EATON Plan at Woods at Lakefield
- THORPE Plan at Woods at Lakefield
- FINNEGAN Plan at Woods at Lakefield
- 18 Greenmere Cir
- Greenbriar Plan at Willow Green - Maple Street Collection
- Jensen Plan at Willow Green - Maple Street Collection
- Yosemite Plan at Willow Green - Maple Street Collection
- Beacon Plan at Willow Green - Maple Street Collection
- Wesley Plan at Willow Green - Maple Street Collection
- Fairfax Plan at Willow Green - Maple Street Collection
- Danville Plan at Willow Green - Maple Street Collection
- Cumberland Plan at Willow Green - Maple Street Collection
- Breckenridge Plan at Willow Green - Maple Street Collection
- 6358 Fieldsteade Dr
- 6350 Fieldsteade Dr
- 775 Lakefield Dr
- 6362 Fieldsteade Dr
- 771 Lakefield Dr
- 6355 Lakearbor Dr
- 6359 Lakearbor Dr
- 6359 Fieldsteade Dr
- 6355 Fieldsteade Dr
- 6363 Fieldsteade Dr
- 6363 Lakearbor Dr
- 767 Lakefield Dr
- 6351 Fieldsteade Dr
- 6366 Fieldsteade Dr
- 6374 Fieldsteade Dr
- 6367 Fieldsteade Dr
- 6347 Fieldsteade Dr
- 6367 Lakearbor Dr
- 776 Lakefield Dr
- 6340 Fieldsteade Dr