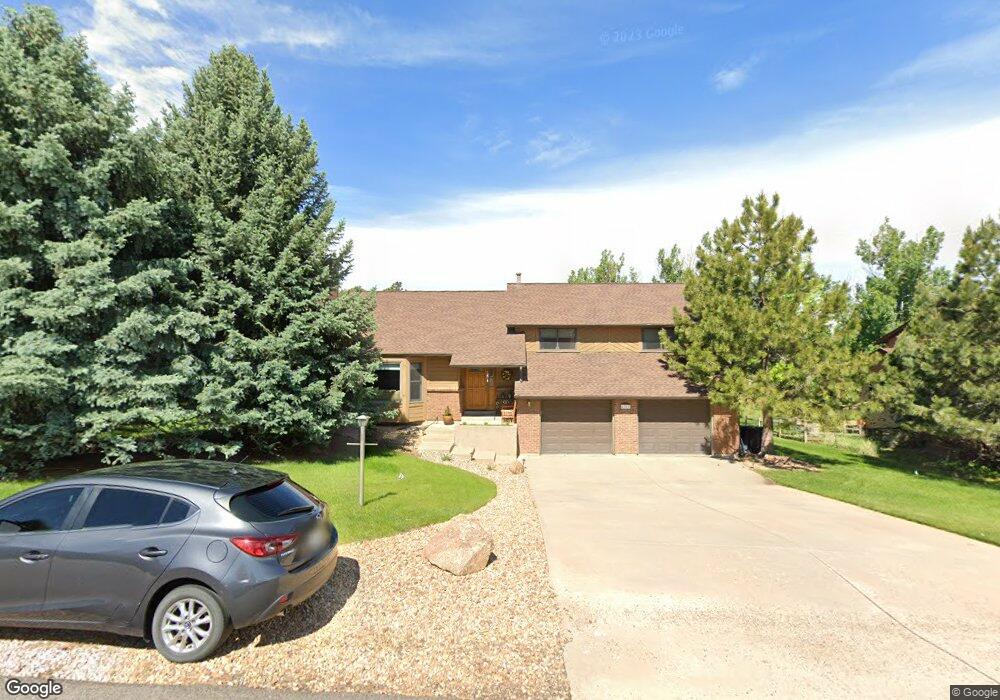
6367 N Mountain View Dr Parker, CO 80134
The Pinery NeighborhoodEstimated Value: $736,000 - $809,000
4
Beds
3
Baths
2,954
Sq Ft
$256/Sq Ft
Est. Value
About This Home
This home is located at 6367 N Mountain View Dr, Parker, CO 80134 and is currently estimated at $755,181, approximately $255 per square foot. 6367 N Mountain View Dr is a home located in Douglas County with nearby schools including Mountain View Elementary School, Northeast Elementary School, and Sagewood Middle School.
Ownership History
Date
Name
Owned For
Owner Type
Purchase Details
Closed on
Jul 11, 2019
Sold by
Gardiner Deborah L
Bought by
Kyker Charles R and Varner Rhonda G
Current Estimated Value
Home Financials for this Owner
Home Financials are based on the most recent Mortgage that was taken out on this home.
Original Mortgage
$471,975
Outstanding Balance
$414,170
Interest Rate
3.9%
Mortgage Type
VA
Estimated Equity
$341,011
Purchase Details
Closed on
Feb 28, 2003
Sold by
Primary Closing Corporation
Bought by
Gardiner Kenneth J and Gardiner Deborah L
Purchase Details
Closed on
Jan 6, 2003
Sold by
Pierson Claude M and Pierson Cherylee
Bought by
Primary Closing Corporation
Purchase Details
Closed on
Jun 25, 1986
Sold by
Buechle Stephanie A
Bought by
Pierson Claude M and Pierson Cherylee
Purchase Details
Closed on
Mar 25, 1983
Sold by
Shewfelt Rob
Bought by
Buechle Otto F and Buechle Mick
Create a Home Valuation Report for This Property
The Home Valuation Report is an in-depth analysis detailing your home's value as well as a comparison with similar homes in the area
Home Values in the Area
Average Home Value in this Area
Purchase History
| Date | Buyer | Sale Price | Title Company |
|---|---|---|---|
| Kyker Charles R | $515,000 | Chicago Title Co | |
| Gardiner Kenneth J | $298,000 | -- | |
| Primary Closing Corporation | $296,000 | -- | |
| Pierson Claude M | $150,000 | -- | |
| Buechle Otto F | $135,000 | -- |
Source: Public Records
Mortgage History
| Date | Status | Borrower | Loan Amount |
|---|---|---|---|
| Open | Kyker Charles R | $471,975 |
Source: Public Records
Tax History Compared to Growth
Tax History
| Year | Tax Paid | Tax Assessment Tax Assessment Total Assessment is a certain percentage of the fair market value that is determined by local assessors to be the total taxable value of land and additions on the property. | Land | Improvement |
|---|---|---|---|---|
| 2024 | $3,902 | $50,430 | $11,330 | $39,100 |
| 2023 | $3,946 | $50,430 | $11,330 | $39,100 |
| 2022 | $2,861 | $35,470 | $6,470 | $29,000 |
| 2021 | $2,979 | $35,470 | $6,470 | $29,000 |
| 2020 | $2,847 | $34,710 | $6,200 | $28,510 |
| 2019 | $2,858 | $34,710 | $6,200 | $28,510 |
| 2018 | $2,529 | $30,180 | $5,690 | $24,490 |
| 2017 | $2,341 | $30,180 | $5,690 | $24,490 |
| 2016 | $2,229 | $28,140 | $4,780 | $23,360 |
| 2015 | $2,285 | $28,140 | $4,780 | $23,360 |
| 2014 | $2,088 | $22,990 | $3,180 | $19,810 |
Source: Public Records
Map
Nearby Homes
- 6571 N Windloch Cir
- 8056 E Windwood Way
- 6177 N Hollowview Ct
- 6628 N Windmont Ave
- 7755 E Lakeshore Dr
- 6171 N Hurricane Ct
- 5769 N Irish Pat Murphy Dr
- 6648 N Hillside Way
- 6809 N Hillside Way
- 7778 E Windwood Way
- 8136 E Stetson Rd
- 5649 N Quinlin Ct
- 5577 N Quinlin Ct
- 6367 N Arapahoe Ct
- 6279 N Cheyenne Ct
- 5953 Angie Ct
- 0 Betts Ranch Rd Unit 6216352
- 5506 N Irish Pat Murphy Dr
- 5542 Ponderosa Dr
- 7420 E Windwood Way
- 6377 N Mountain View Dr
- 6357 N Mountain View Dr
- 6370 N Mountain View Dr
- 6404 N Windmont Ave
- 6360 N Mountain View Dr
- 6387 N Mountain View Dr
- 6347 N Mountain View Dr
- 6380 N Mountain View Dr
- 6366 N Windmont Ave
- 6350 N Mountain View Dr
- 6430 N Windmont Ave
- 6390 N Mountain View Dr
- 6393 N Mountain View Dr
- 6430 N Mountain View Dr
- 6337 N Mountain View Dr
- 6440 N Mountain View Dr
- 6420 N Mountain View Dr
- 6446 N Windmont Ave
- 6340 N Windmont Ave
- 6340 N Mountain View Dr