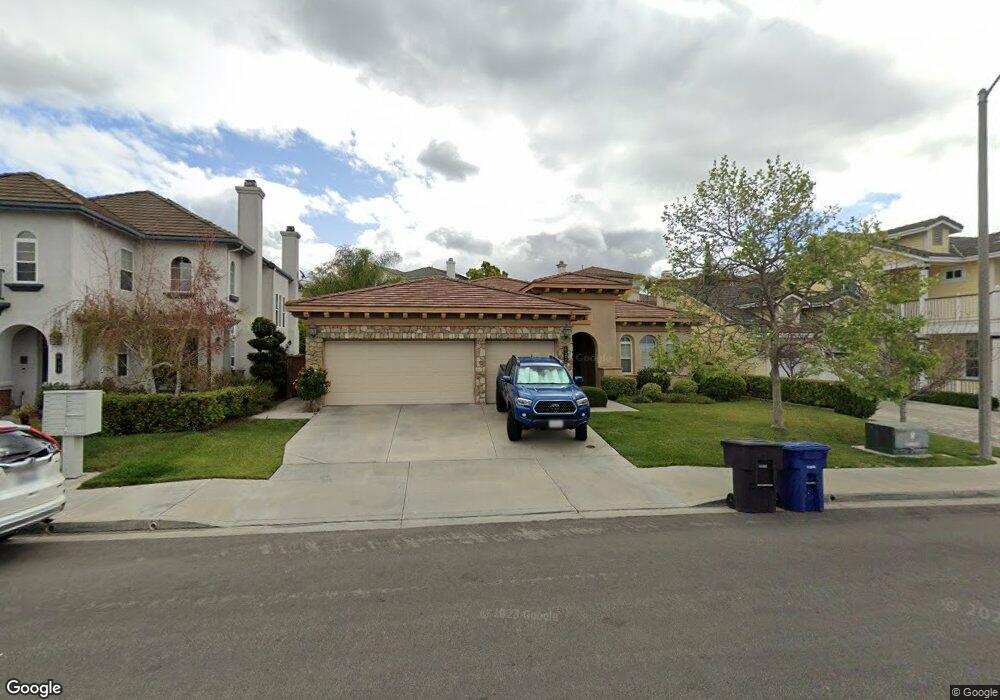
637 Duncan Ranch Rd Chula Vista, CA 91914
Rolling Hills Ranch NeighborhoodEstimated Value: $1,136,000 - $1,254,000
4
Beds
3
Baths
2,248
Sq Ft
$527/Sq Ft
Est. Value
About This Home
This home is located at 637 Duncan Ranch Rd, Chula Vista, CA 91914 and is currently estimated at $1,185,021, approximately $527 per square foot. 637 Duncan Ranch Rd is a home located in San Diego County with nearby schools including Thurgood Marshall Elementary School, Eastlake Middle School, and Eastlake High School.
Ownership History
Date
Name
Owned For
Owner Type
Purchase Details
Closed on
Oct 29, 2015
Sold by
Heidemann Carl R and Heidemann Jessica R
Bought by
Heidemann Jessica R
Current Estimated Value
Home Financials for this Owner
Home Financials are based on the most recent Mortgage that was taken out on this home.
Original Mortgage
$502,500
Outstanding Balance
$394,163
Interest Rate
3.71%
Mortgage Type
New Conventional
Estimated Equity
$790,858
Purchase Details
Closed on
May 17, 2005
Sold by
Heidemann Carl R and Almos Jesse R
Bought by
Heidemann Carl R and Heidemann Jessica R
Home Financials for this Owner
Home Financials are based on the most recent Mortgage that was taken out on this home.
Original Mortgage
$203,000
Interest Rate
5.72%
Mortgage Type
Credit Line Revolving
Create a Home Valuation Report for This Property
The Home Valuation Report is an in-depth analysis detailing your home's value as well as a comparison with similar homes in the area
Home Values in the Area
Average Home Value in this Area
Purchase History
| Date | Buyer | Sale Price | Title Company |
|---|---|---|---|
| Heidemann Jessica R | -- | First American Title Company | |
| Heidemann Carl R | -- | Ticor Title Co Of California |
Source: Public Records
Mortgage History
| Date | Status | Borrower | Loan Amount |
|---|---|---|---|
| Open | Heidemann Jessica R | $502,500 | |
| Closed | Heidemann Carl R | $203,000 |
Source: Public Records
Tax History Compared to Growth
Tax History
| Year | Tax Paid | Tax Assessment Tax Assessment Total Assessment is a certain percentage of the fair market value that is determined by local assessors to be the total taxable value of land and additions on the property. | Land | Improvement |
|---|---|---|---|---|
| 2025 | $7,359 | $647,411 | $217,240 | $430,171 |
| 2024 | $7,359 | $634,718 | $212,981 | $421,737 |
| 2023 | $7,239 | $622,273 | $208,805 | $413,468 |
| 2022 | $7,037 | $610,072 | $204,711 | $405,361 |
| 2021 | $6,871 | $598,111 | $200,698 | $397,413 |
| 2020 | $6,712 | $591,980 | $198,641 | $393,339 |
| 2019 | $6,534 | $580,374 | $194,747 | $385,627 |
| 2018 | $6,430 | $568,995 | $190,929 | $378,066 |
| 2017 | $6,321 | $557,839 | $187,186 | $370,653 |
| 2016 | $6,139 | $546,902 | $183,516 | $363,386 |
| 2015 | $6,060 | $538,688 | $180,760 | $357,928 |
| 2014 | $5,947 | $528,137 | $177,220 | $350,917 |
Source: Public Records
Map
Nearby Homes
- 2706 Valleycreek Cir
- 728 Crooked Path Place Unit 2
- 771 Dry Creek Dr
- 2917 Babbling Brook Rd
- 832 Shadow Ridge Place
- 2567 View Trail Ct Unit 1
- 2547 N Trail Ct Unit 4
- 2946 Ranch Gate Rd
- 2890 Gate Fifteen Place
- 2957 Ranch Gate Rd
- 2532 Oak Knoll Ct
- 428 Evening View Dr
- 671 Via Maggiore
- 2910 Gate Thirteen Place
- 544 Rocking Horse Dr
- 986 White Alder Ave
- 420 Coastal Hills Dr
- 12144 Proctor Valley Rd
- 2264 Huntington Point Rd Unit 102
- 2269 Huntington Point Rd Unit 114
- 641 Duncan Ranch Rd
- 633 Duncan Ranch Rd
- 645 Duncan Ranch Rd Unit 1
- 2825 Durham Place
- 2821 Durham Place Unit 1
- 629 Duncan Ranch Rd
- 2817 Durham Place Unit 1
- 649 Duncan Ranch Rd
- 2829 Durham Place Unit 1
- 625 Duncan Ranch Rd Unit 1
- 630 Wilmington Dr
- 626 Wilmington Dr
- 2813 Durham Place
- 653 Duncan Ranch Rd
- 621 Duncan Ranch Rd
- 640 Wilmington Dr
- 2766 Valleycreek Cir
- 2770 Valleycreek Cir
- 622 Wilmington Dr Unit 1
- 2772 Valleycreek Cir