Estimated Value: $327,000 - $459,000
3
Beds
2
Baths
1,269
Sq Ft
$332/Sq Ft
Est. Value
About This Home
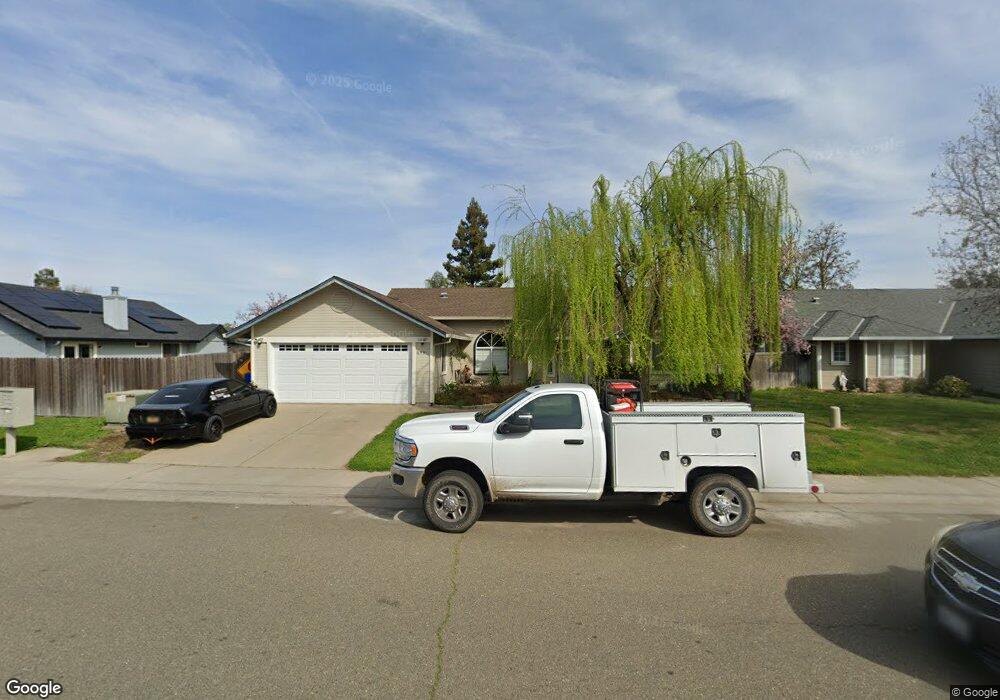
This home is located at 639 Downing Dr, Galt, CA 95632 and is currently estimated at $421,722, approximately $332 per square foot. 639 Downing Dr is a home located in Sacramento County with nearby schools including Valley Oaks Elementary School, Robert L. McCaffrey Middle School, and Galt High School.
Ownership History
Date
Name
Owned For
Owner Type
Purchase Details
Closed on
Mar 1, 2004
Sold by
Merrill Eric S and Merrill Michele M
Bought by
Langetwins Lp
Current Estimated Value
Purchase Details
Closed on
Dec 15, 2001
Sold by
Langetwins Ltd Partnership
Bought by
Merrill Eric S and Merrill Michelle
Purchase Details
Closed on
Aug 24, 1994
Sold by
Bennett & Compton Development Inc
Bought by
Lange Randall W and Lange Charlene
Home Financials for this Owner
Home Financials are based on the most recent Mortgage that was taken out on this home.
Original Mortgage
$21,792
Interest Rate
8.65%
Mortgage Type
Seller Take Back
Create a Home Valuation Report for This Property
The Home Valuation Report is an in-depth analysis detailing your home's value as well as a comparison with similar homes in the area
Home Values in the Area
Average Home Value in this Area
Purchase History
| Date | Buyer | Sale Price | Title Company |
|---|---|---|---|
| Langetwins Lp | $189,500 | -- | |
| Merrill Eric S | $100,500 | Chicago Title Co | |
| Lange Randall W | -- | Chicago Title Company |
Source: Public Records
Mortgage History
| Date | Status | Borrower | Loan Amount |
|---|---|---|---|
| Previous Owner | Lange Randall W | $21,792 |
Source: Public Records
Tax History
| Year | Tax Paid | Tax Assessment Tax Assessment Total Assessment is a certain percentage of the fair market value that is determined by local assessors to be the total taxable value of land and additions on the property. | Land | Improvement |
|---|---|---|---|---|
| 2025 | $3,755 | $341,211 | $99,514 | $241,697 |
| 2024 | $3,755 | $334,521 | $97,563 | $236,958 |
| 2023 | $3,692 | $327,962 | $95,650 | $232,312 |
| 2022 | $3,543 | $321,532 | $93,775 | $227,757 |
| 2021 | $3,547 | $315,229 | $91,937 | $223,292 |
| 2020 | $3,517 | $311,998 | $90,995 | $221,003 |
| 2019 | $3,430 | $305,881 | $89,211 | $216,670 |
| 2018 | $3,296 | $288,599 | $84,169 | $204,430 |
| 2017 | $2,937 | $262,364 | $76,518 | $185,846 |
| 2016 | $2,616 | $238,513 | $69,562 | $168,951 |
| 2015 | $2,466 | $229,340 | $66,887 | $162,453 |
| 2014 | $2,302 | $210,403 | $61,364 | $149,039 |
Source: Public Records
Map
Nearby Homes
- 667 Germaine Dr
- 700 2nd St Unit 40
- 700 2nd St Unit 14
- 718 Crow Creek Cir
- 105 Kent St
- 461 F St
- 712 Church St
- 433 5th St
- 515 E St
- 240 3rd St
- 0 B St Unit 226013319
- 1241 Wilder Way
- 150 Spruce Ave
- 14076 Saradale Ln
- 26572 N Lower Sacramento Rd
- 26598 N Lower Sacramento Rd
- 232 Oak Ave
- 219 Lois Ave
- 246 Oak Ave
- 214 Cinnamon Dr
Your Personal Tour Guide
Ask me questions while you tour the home.