Estimated Value: $332,890 - $375,000
4
Beds
2
Baths
1,575
Sq Ft
$224/Sq Ft
Est. Value
About This Home
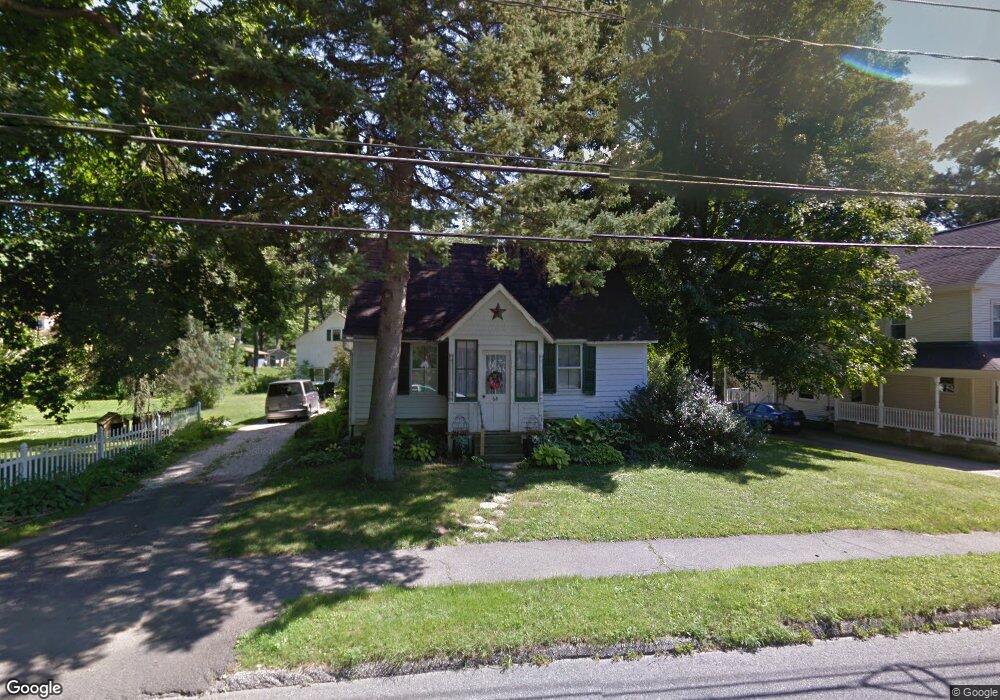
This home is located at 64 E Center St, Lee, MA 01238 and is currently estimated at $353,223, approximately $224 per square foot. 64 E Center St is a home located in Berkshire County with nearby schools including Lee Elementary School, Lee Middle/High School, and St. Mary's School.
Ownership History
Date
Name
Owned For
Owner Type
Purchase Details
Closed on
Jun 8, 2000
Sold by
Fairfield William H and Fairfield Richard
Bought by
Gangell Deborah A
Current Estimated Value
Home Financials for this Owner
Home Financials are based on the most recent Mortgage that was taken out on this home.
Original Mortgage
$68,000
Outstanding Balance
$23,802
Interest Rate
8.12%
Mortgage Type
Purchase Money Mortgage
Estimated Equity
$329,421
Create a Home Valuation Report for This Property
The Home Valuation Report is an in-depth analysis detailing your home's value as well as a comparison with similar homes in the area
Home Values in the Area
Average Home Value in this Area
Purchase History
| Date | Buyer | Sale Price | Title Company |
|---|---|---|---|
| Gangell Deborah A | $118,000 | -- |
Source: Public Records
Mortgage History
| Date | Status | Borrower | Loan Amount |
|---|---|---|---|
| Open | Gangell Deborah A | $68,000 |
Source: Public Records
Tax History
| Year | Tax Paid | Tax Assessment Tax Assessment Total Assessment is a certain percentage of the fair market value that is determined by local assessors to be the total taxable value of land and additions on the property. | Land | Improvement |
|---|---|---|---|---|
| 2025 | $3,074 | $273,200 | $78,900 | $194,300 |
| 2024 | $3,218 | $286,300 | $77,300 | $209,000 |
| 2023 | $3,015 | $254,900 | $73,400 | $181,500 |
| 2022 | $2,879 | $210,900 | $63,700 | $147,200 |
| 2021 | $3,136 | $213,600 | $87,200 | $126,400 |
| 2020 | $2,957 | $201,400 | $81,700 | $119,700 |
| 2019 | $3,039 | $205,600 | $83,700 | $121,900 |
| 2018 | $3,008 | $205,600 | $83,700 | $121,900 |
| 2017 | $2,976 | $202,200 | $71,500 | $130,700 |
| 2016 | $2,913 | $200,100 | $69,400 | $130,700 |
| 2015 | $2,817 | $200,100 | $69,400 | $130,700 |
| 2014 | $2,696 | $190,500 | $69,400 | $121,100 |
Source: Public Records
Map
Nearby Homes
- 180 Center St
- 160 High St
- 205 High St
- 30 Pease Terrace
- 131 Center St
- 290 E Center St
- 0 East St Unit 235893
- 155 Laurel St
- 135 East St
- 140 Theresa Terrace
- 2 Devon Rd
- 184 Washington Mountain Rd
- 615 Laurel St
- 528 Walker St
- 524 Walker St
- 45 Forest St
- 500 Walker St
- 2 Saint Andrews Ct
- 770 Summer St Unit 5D
- 560 Stockbridge Rd
Your Personal Tour Guide
Ask me questions while you tour the home.