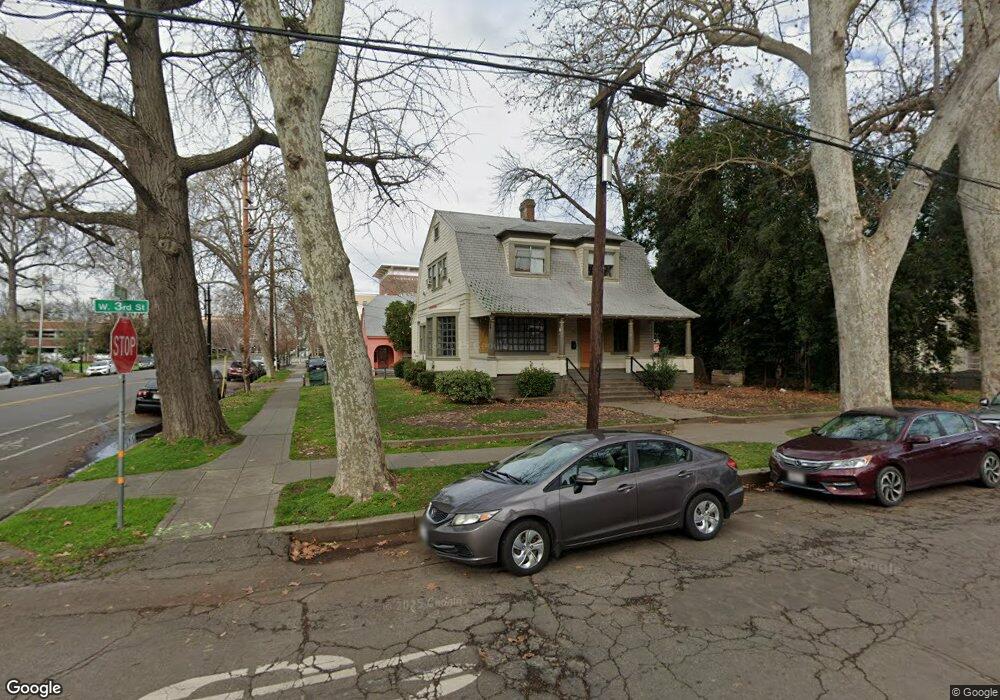
642 W 3rd St Chico, CA 95928
South Campus NeighborhoodEstimated Value: $545,087 - $658,000
3
Beds
1
Bath
850
Sq Ft
$714/Sq Ft
Est. Value
About This Home
This home is located at 642 W 3rd St, Chico, CA 95928 and is currently estimated at $606,772, approximately $713 per square foot. 642 W 3rd St is a home located in Butte County with nearby schools including Citrus Avenue Elementary School, Chico Junior High School, and Chico High School.
Ownership History
Date
Name
Owned For
Owner Type
Purchase Details
Closed on
Jul 26, 2017
Sold by
Castleberry George
Bought by
Castleberry Richard and Castleberry Elen
Current Estimated Value
Home Financials for this Owner
Home Financials are based on the most recent Mortgage that was taken out on this home.
Original Mortgage
$314,000
Outstanding Balance
$215,530
Interest Rate
3.91%
Mortgage Type
New Conventional
Estimated Equity
$391,242
Purchase Details
Closed on
May 11, 2015
Sold by
Castleberry R L
Bought by
The Richard Castleberry & Elen Castleber
Purchase Details
Closed on
Jan 7, 2002
Sold by
Castleberry R L
Bought by
Castleberry R L and Castleberry Elen
Purchase Details
Closed on
Apr 29, 1999
Sold by
Lambda Pi Fraternity Alumni Assn
Bought by
Castleberry R L and Castleberry Elen
Home Financials for this Owner
Home Financials are based on the most recent Mortgage that was taken out on this home.
Original Mortgage
$101,250
Interest Rate
6.96%
Mortgage Type
Seller Take Back
Create a Home Valuation Report for This Property
The Home Valuation Report is an in-depth analysis detailing your home's value as well as a comparison with similar homes in the area
Home Values in the Area
Average Home Value in this Area
Purchase History
| Date | Buyer | Sale Price | Title Company |
|---|---|---|---|
| Castleberry Richard | $84,000 | Mid Vally Title & Escrow Co | |
| The Richard Castleberry & Elen Castleber | -- | None Available | |
| Castleberry R L | $17,500 | Mid Valley Title | |
| Castleberry R L | $135,000 | Mid Valley Title & Escrow Co |
Source: Public Records
Mortgage History
| Date | Status | Borrower | Loan Amount |
|---|---|---|---|
| Open | Castleberry Richard | $314,000 | |
| Previous Owner | Castleberry R L | $101,250 |
Source: Public Records
Tax History
| Year | Tax Paid | Tax Assessment Tax Assessment Total Assessment is a certain percentage of the fair market value that is determined by local assessors to be the total taxable value of land and additions on the property. | Land | Improvement |
|---|---|---|---|---|
| 2025 | $4,837 | $446,150 | $171,112 | $275,038 |
| 2024 | $4,837 | $437,403 | $167,757 | $269,646 |
| 2023 | $4,780 | $428,827 | $164,468 | $264,359 |
| 2022 | $4,704 | $420,420 | $161,244 | $259,176 |
| 2021 | $4,615 | $412,178 | $158,083 | $254,095 |
| 2020 | $4,602 | $407,953 | $156,463 | $251,490 |
| 2019 | $4,519 | $399,955 | $153,396 | $246,559 |
| 2018 | $4,436 | $392,114 | $150,389 | $241,725 |
| 2017 | $3,610 | $319,198 | $107,149 | $212,049 |
| 2016 | $3,295 | $312,941 | $105,049 | $207,892 |
| 2015 | $3,295 | $308,242 | $103,472 | $204,770 |
| 2014 | $3,215 | $302,205 | $101,446 | $200,759 |
Source: Public Records
Map
Nearby Homes
Your Personal Tour Guide
Ask me questions while you tour the home.