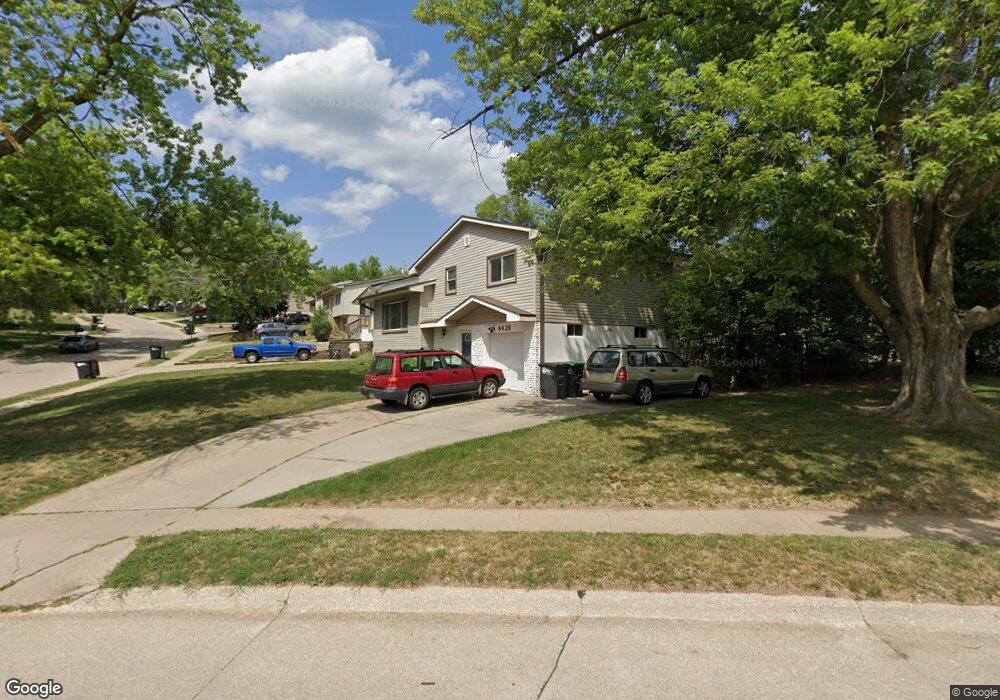
6429 N 75th St Omaha, IA 68134
Wood Bridge NeighborhoodEstimated Value: $233,000 - $254,000
4
Beds
2
Baths
1,330
Sq Ft
$183/Sq Ft
Est. Value
About This Home
This home is located at 6429 N 75th St, Omaha, IA 68134 and is currently estimated at $243,218, approximately $182 per square foot. 6429 N 75th St is a home located in Douglas County with nearby schools including Pinewood Elementary School, Nathan Hale Magnet Middle School, and Northwest High School.
Ownership History
Date
Name
Owned For
Owner Type
Purchase Details
Closed on
Nov 10, 2020
Sold by
Thompson Ashley and Richardson Austin
Bought by
Wickwire Rolland Scott and Wickwire Sonja
Current Estimated Value
Home Financials for this Owner
Home Financials are based on the most recent Mortgage that was taken out on this home.
Original Mortgage
$167,411
Outstanding Balance
$148,972
Interest Rate
2.8%
Mortgage Type
FHA
Estimated Equity
$94,246
Purchase Details
Closed on
Jul 9, 2014
Sold by
Mcgavren Glen E and Mcgavren April D
Bought by
Thompson Ashley and Richardson Austin
Home Financials for this Owner
Home Financials are based on the most recent Mortgage that was taken out on this home.
Original Mortgage
$106,043
Interest Rate
3.75%
Mortgage Type
FHA
Purchase Details
Closed on
Apr 29, 2005
Sold by
Watts Michael L
Bought by
Mcgaven Glen E
Purchase Details
Closed on
Nov 21, 2002
Sold by
Watts Michael J and Watts Laura E
Bought by
Watts Michael L and Watts Laura E
Create a Home Valuation Report for This Property
The Home Valuation Report is an in-depth analysis detailing your home's value as well as a comparison with similar homes in the area
Home Values in the Area
Average Home Value in this Area
Purchase History
| Date | Buyer | Sale Price | Title Company |
|---|---|---|---|
| Wickwire Rolland Scott | $171,000 | None Available | |
| Thompson Ashley | $108,000 | None Available | |
| Mcgaven Glen E | $112,000 | -- | |
| Watts Michael L | -- | -- |
Source: Public Records
Mortgage History
| Date | Status | Borrower | Loan Amount |
|---|---|---|---|
| Open | Wickwire Rolland Scott | $167,411 | |
| Previous Owner | Thompson Ashley | $106,043 |
Source: Public Records
Tax History Compared to Growth
Tax History
| Year | Tax Paid | Tax Assessment Tax Assessment Total Assessment is a certain percentage of the fair market value that is determined by local assessors to be the total taxable value of land and additions on the property. | Land | Improvement |
|---|---|---|---|---|
| 2024 | $3,732 | $189,700 | $25,300 | $164,400 |
| 2023 | $3,732 | $176,900 | $25,300 | $151,600 |
| 2022 | $3,296 | $154,400 | $25,300 | $129,100 |
| 2021 | $2,686 | $126,900 | $25,300 | $101,600 |
| 2020 | $2,717 | $126,900 | $25,300 | $101,600 |
| 2019 | $2,680 | $124,800 | $45,700 | $79,100 |
| 2018 | $2,683 | $124,800 | $45,700 | $79,100 |
| 2017 | $2,298 | $107,100 | $45,700 | $61,400 |
| 2016 | $2,298 | $107,100 | $9,200 | $97,900 |
| 2015 | $2,119 | $100,100 | $8,600 | $91,500 |
| 2014 | $2,119 | $100,100 | $8,600 | $91,500 |
Source: Public Records
Map
Nearby Homes
- 7617 Newport Ave
- 7654 Nebraska Ave
- 6407 N 78th Ave
- 7865 Mary St
- 7527 Ernst St
- 6404 N 79th Ave
- 5820 N 78th St
- 7806 Read Plaza
- 7216 N 71st Ave
- 7522 Hartman Ave
- 7165 N 78th Ct
- 7125 Iowa St
- 7157 N 78th Ct
- 7168 N 78th Ct
- 7021 N 79th Ct
- 7173 N 79th Ct
- 7189 N 79th Ct
- 7195 N 79th Ct
- 7196 N 79th Ct
- 7922 Himebaugh Ave
- 6429 N 75th St
- 6511 N 75th St
- 6423 N 75th St
- 6515 N 75th St
- 6430 N 75th St
- 7504 Redick Ave
- 6418 N 75th St
- 6417 N 75th St
- 6519 N 75th St
- 6512 N 75th St
- 6518 N 75th St
- 6411 N 75th St
- 6523 N 75th St
- 6410 N 75th St
- 7510 Redick Ave
- 7517 Redick Ave
- 6423 N 76th St
- 6524 N 75th St
- 6405 N 75th St
- 6527 N 75th St