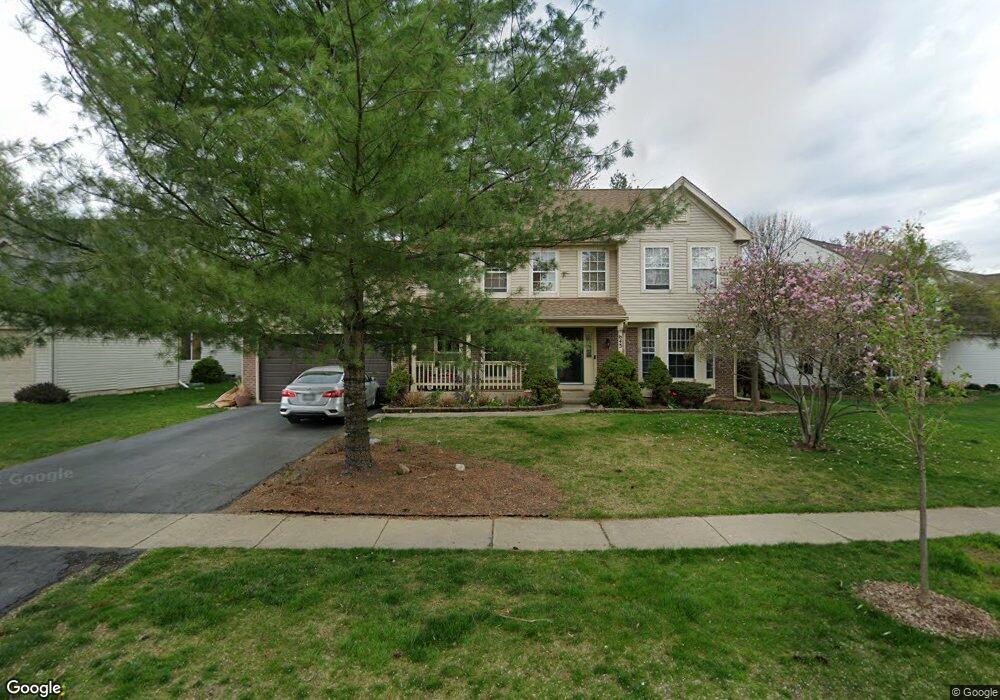
643 Pearces Ford Oswego, IL 60543
North Oswego NeighborhoodEstimated Value: $457,000 - $485,000
About This Home
This home is located at 643 Pearces Ford, Oswego, IL 60543 and is currently estimated at $470,324, approximately $186 per square foot. 643 Pearces Ford is a home located in Kendall County with nearby schools including Old Post Elementary School, Thompson Jr. High School, and Oswego High School.
Ownership History
We collect this data history from publicly available records. To have your information removed, we recommend requesting removal directly through your county’s website.
Purchase Details
Home Financials for this Owner
Home Financials are based on the most recent Mortgage that was taken out on this home.Purchase Details
Home Financials for this Owner
Home Financials are based on the most recent Mortgage that was taken out on this home.Purchase Details
Purchase Details
Home Values in the Area
Average Home Value in this Area
Purchase History
We collect this data history from publicly available records. To have your information removed, we recommend requesting removal directly through your county’s website.
| Date | Buyer | Sale Price | Title Company |
|---|---|---|---|
| $230,500 | First American Title Co | ||
| $213,000 | -- | ||
| $205,900 | -- | ||
| $760,000 | -- |
Mortgage History
We collect this data history from publicly available records. To have your information removed, we recommend requesting removal directly through your county’s website.
| Date | Status | Borrower | Loan Amount |
|---|---|---|---|
| Previous Owner | $150,000 | ||
| Previous Owner | $138,000 | ||
| Closed | -- |
Tax History
We collect this data history from publicly available records. To have your information removed, we recommend requesting removal directly through your county’s website.
| Year | Tax Paid | Tax Assessment Tax Assessment Total Assessment is a certain percentage of the fair market value that is determined by local assessors to be the total taxable value of land and additions on the property. | Land | Improvement |
|---|---|---|---|---|
| 2025 | $9,984 | $136,572 | $33,083 | $103,489 |
| 2024 | $9,984 | $130,069 | $31,508 | $98,561 |
| 2023 | $8,907 | $115,105 | $27,883 | $87,222 |
| 2022 | $8,907 | $104,641 | $25,348 | $79,293 |
| 2021 | $8,589 | $97,796 | $23,690 | $74,106 |
| 2020 | $8,405 | $94,948 | $23,000 | $71,948 |
| 2019 | $8,752 | $97,174 | $23,000 | $74,174 |
| 2018 | $8,591 | $92,662 | $21,586 | $71,076 |
| 2017 | $8,519 | $89,098 | $20,756 | $68,342 |
| 2016 | $8,461 | $87,351 | $20,349 | $67,002 |
| 2015 | $8,597 | $84,806 | $19,756 | $65,050 |
| 2014 | -- | $82,336 | $19,181 | $63,155 |
| 2013 | -- | $83,168 | $19,375 | $63,793 |
Map
- 40 Cayman Dr
- 4 Saugatuck Rd
- 324 Boulder Hill Pass
- 33 Somerset Rd
- 542 Waterford Dr
- 18 Cayman Dr
- 496 Waubonsee Cir
- 48 Pueblo Rd
- 301 Stoneleigh Ln
- 328 Barnaby Dr
- 34 Scarsdale Rd
- 4 Barclay Ct
- 12 Sherwick Rd
- 69 Paddock St
- 22 Guilford Rd
- 9 Cebold Dr
- 546 Tewksbury Cir
- 265 Grays Dr Unit 4
- 74 Seton Creek Dr
- 128 Saugatuck Rd
- 645 Pearces Ford
- 641 Pearces Ford
- 645 Pearces Ford Rd
- 647 Pearces Ford
- 647 Pearces Ford Rd
- 639 Pearces Ford Rd
- 639 Pearces Ford
- 408 Joseph Ct
- 642 Pearces Ford
- 644 Pearces Ford
- 640 Pearces Ford
- 640 Pearces Ford Rd
- 649 Pearces Ford
- 646 Pearces Ford Rd
- 646 Pearces Ford
- 637 Pearces Ford
- 406 Joseph Ct
- 648 Pearces Ford
- 410 Joseph Ct
- 90 Old Post Rd
Ask me questions while you tour the home.