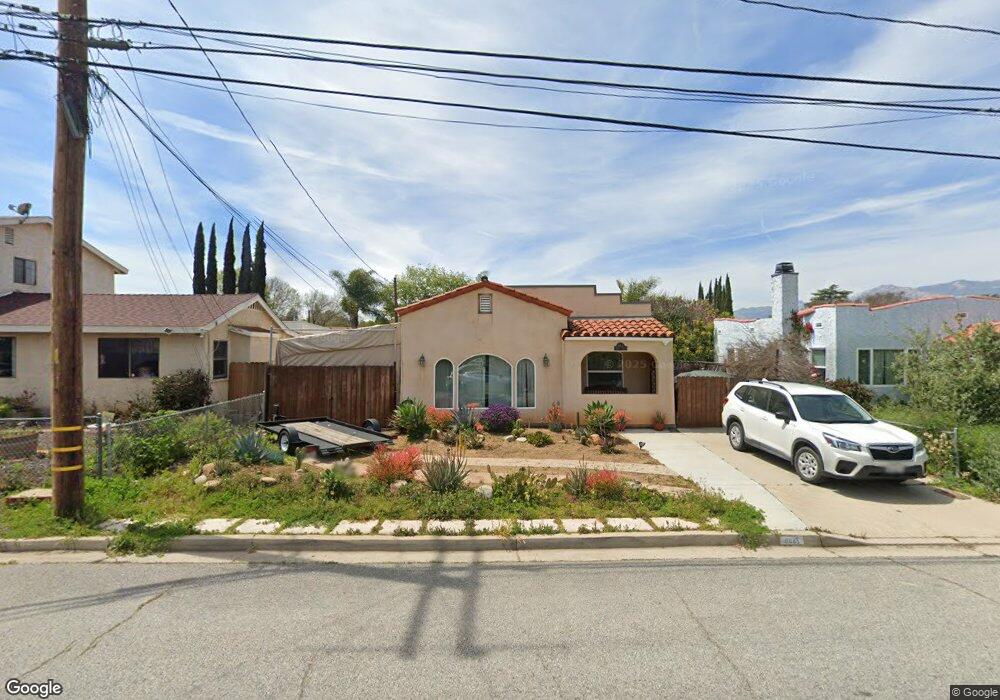
643 Spring St Oak View, CA 93022
Estimated Value: $644,000 - $755,000
2
Beds
1
Bath
982
Sq Ft
$716/Sq Ft
Est. Value
About This Home
This home is located at 643 Spring St, Oak View, CA 93022 and is currently estimated at $703,556, approximately $716 per square foot. 643 Spring St is a home located in Ventura County with nearby schools including Sunset Elementary School, De Anza Academy Of Technology And The Arts, and Ventura High School.
Ownership History
Date
Name
Owned For
Owner Type
Purchase Details
Closed on
Mar 30, 2012
Sold by
Phelps Erin D and Pankey Erin D
Bought by
Phelps Erin D and Phelps Richard William
Current Estimated Value
Home Financials for this Owner
Home Financials are based on the most recent Mortgage that was taken out on this home.
Original Mortgage
$253,884
Outstanding Balance
$178,147
Interest Rate
4.25%
Mortgage Type
FHA
Estimated Equity
$525,409
Purchase Details
Closed on
May 5, 2009
Sold by
Lasalle Bank National Association
Bought by
Pankey Erin D
Home Financials for this Owner
Home Financials are based on the most recent Mortgage that was taken out on this home.
Original Mortgage
$263,639
Interest Rate
5.37%
Mortgage Type
FHA
Purchase Details
Closed on
Aug 25, 2008
Sold by
Correa Refugio M and Ramirez Maria C
Bought by
Lasalle Bank Na
Purchase Details
Closed on
Mar 22, 2004
Sold by
Whyman Barbara
Bought by
Correa Refugio M and Ramirez Maria C
Home Financials for this Owner
Home Financials are based on the most recent Mortgage that was taken out on this home.
Original Mortgage
$324,000
Interest Rate
6.25%
Mortgage Type
Purchase Money Mortgage
Purchase Details
Closed on
Aug 11, 1998
Sold by
Pearson Gray
Bought by
Whyman Barbara
Home Financials for this Owner
Home Financials are based on the most recent Mortgage that was taken out on this home.
Original Mortgage
$55,000
Interest Rate
6.93%
Purchase Details
Closed on
Sep 28, 1995
Sold by
Burton Michaeleen J
Bought by
Pearson Gray
Home Financials for this Owner
Home Financials are based on the most recent Mortgage that was taken out on this home.
Original Mortgage
$116,800
Interest Rate
7.59%
Purchase Details
Closed on
Jul 24, 1995
Sold by
Burton Ronald Q
Bought by
Burton Michaeleen J
Purchase Details
Closed on
Apr 25, 1995
Sold by
Burton Michaeleen J
Bought by
Burton Michaeleen J
Create a Home Valuation Report for This Property
The Home Valuation Report is an in-depth analysis detailing your home's value as well as a comparison with similar homes in the area
Home Values in the Area
Average Home Value in this Area
Purchase History
| Date | Buyer | Sale Price | Title Company |
|---|---|---|---|
| Phelps Erin D | -- | Ticor Title | |
| Pankey Erin D | $221,000 | First American Title Ins Co | |
| Lasalle Bank Na | $297,500 | Accommodation | |
| Correa Refugio M | $405,000 | Old Republic Title Company | |
| Whyman Barbara | $150,000 | -- | |
| Pearson Gray | $123,000 | Old Republic Title Company | |
| Burton Michaeleen J | -- | Old Republic Title Company | |
| Burton Michaeleen J | -- | -- |
Source: Public Records
Mortgage History
| Date | Status | Borrower | Loan Amount |
|---|---|---|---|
| Open | Phelps Erin D | $253,884 | |
| Previous Owner | Pankey Erin D | $263,639 | |
| Previous Owner | Correa Refugio M | $324,000 | |
| Previous Owner | Whyman Barbara | $55,000 | |
| Previous Owner | Pearson Gray | $116,800 | |
| Closed | Correa Refugio M | $81,000 |
Source: Public Records
Tax History
| Year | Tax Paid | Tax Assessment Tax Assessment Total Assessment is a certain percentage of the fair market value that is determined by local assessors to be the total taxable value of land and additions on the property. | Land | Improvement |
|---|---|---|---|---|
| 2025 | $3,872 | $285,253 | $148,435 | $136,818 |
| 2024 | $3,872 | $279,660 | $145,524 | $134,136 |
| 2023 | $3,801 | $274,177 | $142,671 | $131,506 |
| 2022 | $3,608 | $268,801 | $139,873 | $128,928 |
| 2021 | $3,545 | $263,531 | $137,131 | $126,400 |
| 2020 | $3,501 | $260,830 | $135,726 | $125,104 |
| 2019 | $3,433 | $255,716 | $133,065 | $122,651 |
| 2018 | $3,370 | $250,703 | $130,456 | $120,247 |
| 2017 | $3,314 | $245,789 | $127,899 | $117,890 |
| 2016 | $3,263 | $240,971 | $125,392 | $115,579 |
| 2015 | $3,221 | $237,353 | $123,509 | $113,844 |
| 2014 | $3,181 | $232,706 | $121,091 | $111,615 |
Source: Public Records
Map
Nearby Homes
- 385 Sunset Ave
- 543 Good Hope St
- 109 Portal St
- 1125 Spring St
- 110 E Oak View Ave
- 182 Mountain View St
- 130 Olive St
- 75 Maxine Ave
- 10505 Dale Ave
- 700 Thomas St
- 358 Sunset Ct
- 0 Thomas St
- 1176 N Ventura Ave
- 350 Riverside Rd
- 10681 Encino Dr
- 10920 Ventura Ave
- 401 Burnham Rd
- 9097 N Ventura Ave Unit 8
- 10980 N Ventura Ave
- 8994 Nye Rd
Your Personal Tour Guide
Ask me questions while you tour the home.