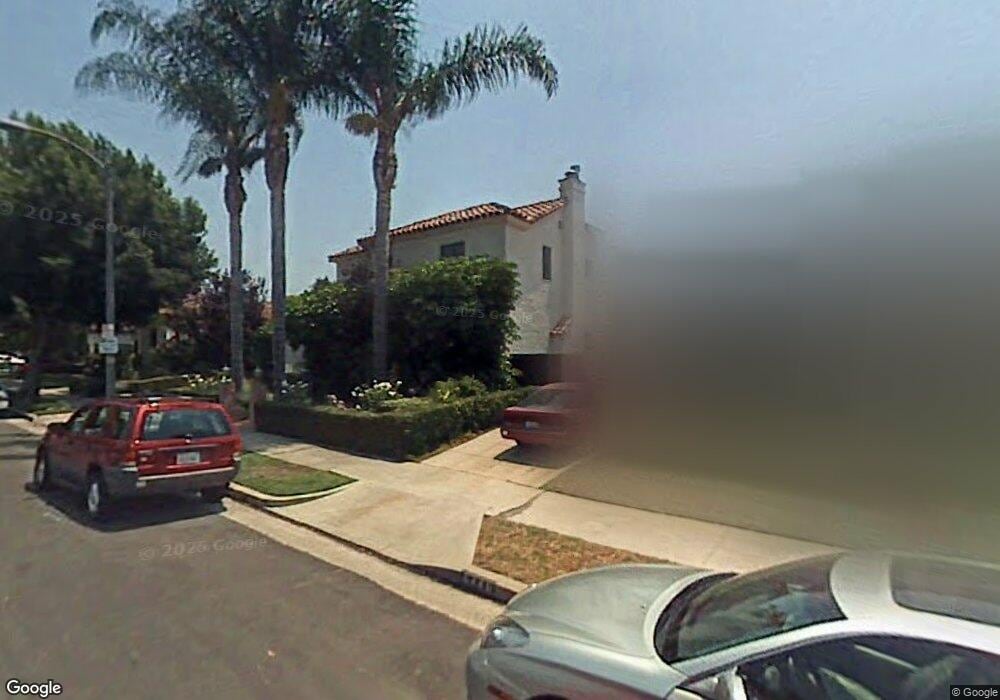
6436 Lindenhurst Ave Los Angeles, CA 90048
Beverly Grove NeighborhoodEstimated Value: $2,058,683 - $2,674,000
3
Beds
2
Baths
2,032
Sq Ft
$1,183/Sq Ft
Est. Value
About This Home
This home is located at 6436 Lindenhurst Ave, Los Angeles, CA 90048 and is currently estimated at $2,403,171, approximately $1,182 per square foot. 6436 Lindenhurst Ave is a home located in Los Angeles County with nearby schools including Hancock Park Elementary, John Burroughs Middle School, and Fairfax High School.
Ownership History
Date
Name
Owned For
Owner Type
Purchase Details
Closed on
Jul 16, 2015
Sold by
Gurman Arnon
Bought by
Gurman Family Trust
Current Estimated Value
Home Financials for this Owner
Home Financials are based on the most recent Mortgage that was taken out on this home.
Original Mortgage
$500,000
Outstanding Balance
$391,903
Interest Rate
4.01%
Mortgage Type
New Conventional
Estimated Equity
$2,011,268
Purchase Details
Closed on
Apr 30, 2007
Sold by
Gurman Arnon and Gurman Michelle
Bought by
Gurman Arnon
Purchase Details
Closed on
Aug 2, 1995
Sold by
Household Bank Fsb
Bought by
Gurman Arnon
Home Financials for this Owner
Home Financials are based on the most recent Mortgage that was taken out on this home.
Original Mortgage
$195,375
Interest Rate
7.83%
Purchase Details
Closed on
May 2, 1995
Sold by
Emmar Solomon and Emmar Irit
Bought by
Household Bank Fsb
Create a Home Valuation Report for This Property
The Home Valuation Report is an in-depth analysis detailing your home's value as well as a comparison with similar homes in the area
Home Values in the Area
Average Home Value in this Area
Purchase History
| Date | Buyer | Sale Price | Title Company |
|---|---|---|---|
| Gurman Family Trust | -- | Westminster Title Co Inc | |
| Gurman Amon | -- | Westminster Title Co Inc | |
| Gurman Arnon | -- | None Available | |
| Gurman Arnon | $260,500 | Chicago Title Co | |
| Household Bank Fsb | $541,322 | First Southwestern Title |
Source: Public Records
Mortgage History
| Date | Status | Borrower | Loan Amount |
|---|---|---|---|
| Open | Gurman Amon | $500,000 | |
| Closed | Gurman Arnon | $195,375 |
Source: Public Records
Tax History Compared to Growth
Tax History
| Year | Tax Paid | Tax Assessment Tax Assessment Total Assessment is a certain percentage of the fair market value that is determined by local assessors to be the total taxable value of land and additions on the property. | Land | Improvement |
|---|---|---|---|---|
| 2025 | $5,345 | $432,730 | $290,707 | $142,023 |
| 2024 | $5,345 | $424,246 | $285,007 | $139,239 |
| 2023 | $5,248 | $415,928 | $279,419 | $136,509 |
| 2022 | $5,013 | $407,774 | $273,941 | $133,833 |
| 2021 | $4,939 | $399,779 | $268,570 | $131,209 |
| 2019 | $4,794 | $387,923 | $260,605 | $127,318 |
| 2018 | $4,718 | $380,318 | $255,496 | $124,822 |
| 2016 | $4,496 | $365,552 | $245,576 | $119,976 |
| 2015 | $4,431 | $360,062 | $241,888 | $118,174 |
| 2014 | $4,453 | $353,010 | $237,150 | $115,860 |
Source: Public Records
Map
Nearby Homes
- 6420 Orange St
- 6402 Maryland Dr
- 6526 Lindenhurst Ave
- 6451 Maryland Dr
- 6531 Orange St
- 6360 Maryland Dr
- 6366 Orange St
- 6511 Maryland Dr
- 6347 Orange St
- 6336 Lindenhurst Ave
- 6607 Maryland Dr
- 6410 Drexel Ave
- 6638 Lindenhurst Ave
- 6300 Lindenhurst Ave
- 742 Schumacher Dr
- 6546 Colgate Ave
- 6509 Colgate Ave
- 6657 W 5th St
- 6206 Lindenhurst Ave
- 8206 W 4th St
- 6440 Lindenhurst Ave
- 6432 Lindenhurst Ave
- 6426 Lindenhurst Ave
- 6446 Lindenhurst Ave
- 6448 Lindenhurst Ave
- 6435 W 6th St
- 6441 W 6th St
- 6431 W 6th St
- 6443 W 6th St
- 6450 Lindenhurst Ave
- 6420 Lindenhurst Ave
- 6447 W 6th St
- 6427 W 6th St Unit 1
- 6427 W 6th St
- 6437 Lindenhurst Ave
- 6431 Lindenhurst Ave
- 6443 Lindenhurst Ave
- 6451 W 6th St
- 6421 W 6th St
- 6500 Lindenhurst Ave