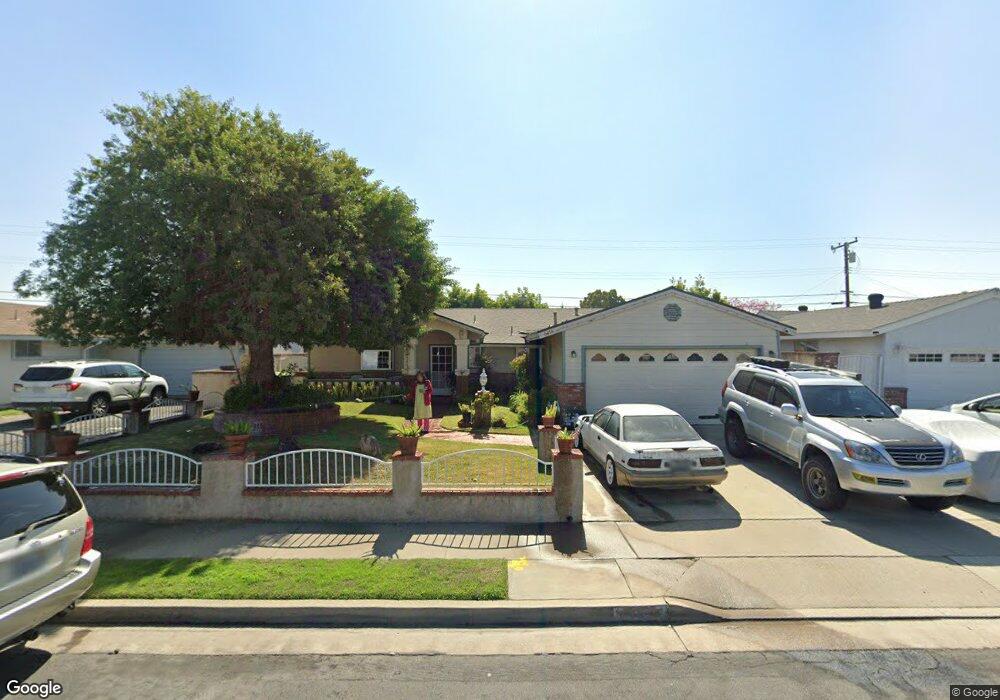
6454 Cecilia Cir Buena Park, CA 90620
Estimated Value: $969,000 - $1,030,000
4
Beds
3
Baths
1,698
Sq Ft
$584/Sq Ft
Est. Value
About This Home
This home is located at 6454 Cecilia Cir, Buena Park, CA 90620 and is currently estimated at $991,895, approximately $584 per square foot. 6454 Cecilia Cir is a home located in Orange County with nearby schools including Frank Vessels Elementary School, Lexington Junior High School, and Cypress High School.
Ownership History
Date
Name
Owned For
Owner Type
Purchase Details
Closed on
Aug 30, 2019
Sold by
Torculas Neilta I
Bought by
Torculas Neilta I and Torculas Menard I
Current Estimated Value
Home Financials for this Owner
Home Financials are based on the most recent Mortgage that was taken out on this home.
Original Mortgage
$415,000
Outstanding Balance
$364,250
Interest Rate
3.7%
Mortgage Type
New Conventional
Estimated Equity
$627,645
Purchase Details
Closed on
Jan 10, 2001
Sold by
Torculas Ray L and Ilog Norman G
Bought by
Torculas Nelita I
Home Financials for this Owner
Home Financials are based on the most recent Mortgage that was taken out on this home.
Original Mortgage
$176,000
Interest Rate
7.08%
Purchase Details
Closed on
Jun 6, 1997
Sold by
Lund Ingemann E and Lund Julie L
Bought by
Torculas Ray L and Torculas Nelita I
Home Financials for this Owner
Home Financials are based on the most recent Mortgage that was taken out on this home.
Original Mortgage
$165,750
Interest Rate
7.83%
Create a Home Valuation Report for This Property
The Home Valuation Report is an in-depth analysis detailing your home's value as well as a comparison with similar homes in the area
Home Values in the Area
Average Home Value in this Area
Purchase History
| Date | Buyer | Sale Price | Title Company |
|---|---|---|---|
| Torculas Neilta I | -- | Fidelity Natl Ttl Orange Cnt | |
| Torculas Nelita I | -- | Chicago Title Co | |
| Torculas Ray L | $174,500 | Landwood Title Company |
Source: Public Records
Mortgage History
| Date | Status | Borrower | Loan Amount |
|---|---|---|---|
| Open | Torculas Neilta I | $415,000 | |
| Closed | Torculas Nelita I | $176,000 | |
| Previous Owner | Torculas Ray L | $165,750 |
Source: Public Records
Tax History Compared to Growth
Tax History
| Year | Tax Paid | Tax Assessment Tax Assessment Total Assessment is a certain percentage of the fair market value that is determined by local assessors to be the total taxable value of land and additions on the property. | Land | Improvement |
|---|---|---|---|---|
| 2025 | $4,216 | $366,348 | $243,810 | $122,538 |
| 2024 | $4,216 | $359,165 | $239,029 | $120,136 |
| 2023 | $4,117 | $352,123 | $234,342 | $117,781 |
| 2022 | $4,066 | $345,219 | $229,747 | $115,472 |
| 2021 | $4,011 | $338,450 | $225,242 | $113,208 |
| 2020 | $3,994 | $334,980 | $222,932 | $112,048 |
| 2019 | $3,884 | $328,412 | $218,561 | $109,851 |
| 2018 | $3,831 | $321,973 | $214,275 | $107,698 |
| 2017 | $3,701 | $315,660 | $210,073 | $105,587 |
| 2016 | $3,668 | $309,471 | $205,954 | $103,517 |
| 2015 | $3,640 | $304,823 | $202,860 | $101,963 |
| 2014 | $3,449 | $298,852 | $198,886 | $99,966 |
Source: Public Records
Map
Nearby Homes
- 6431 Cathay Cir
- 6526 Corinne Cir
- 3565 W Stonepine Ln Unit B
- 9792 Juanita St
- 9704 Doreen Dr
- 6034 Fred Dr
- 7085 Cerritos Ave Unit 16
- 9856 Lido Way Unit 19
- 9866 Lido Way Unit 20
- 10700 Knott Ave
- 9694 Mount Barnard Dr
- 6036 Jeffrey Mark St
- 5763 Laguna Way Unit 49
- 5841 Laguna Way Unit 62
- 6344 Orange Ave
- 6166 Orange Ave
- 1305 S Westchester Dr
- 9592 Sonwell Place
- 7224 Kermore Ln
- 6062 Lime Ave
- 6442 Cecilia Cir
- 6455 Celeste Cir
- 6443 Celeste Cir
- 6467 Celeste Cir
- 6430 Cecilia Cir
- 6478 Cecilia Cir
- 6455 Cecilia Cir
- 6479 Celeste Cir
- 6431 Celeste Cir
- 6443 Cecilia Cir
- 6467 Cecilia Cir
- 6420 Cecilia Cir
- 6431 Cecilia Cir
- 6490 Cecilia Cir
- 6479 Cecilia Cir
- 6421 Celeste Cir
- 6491 Celeste Cir
- 6421 Cecilia Cir
- 6410 Cecilia Cir
- 6491 Cecilia Cir