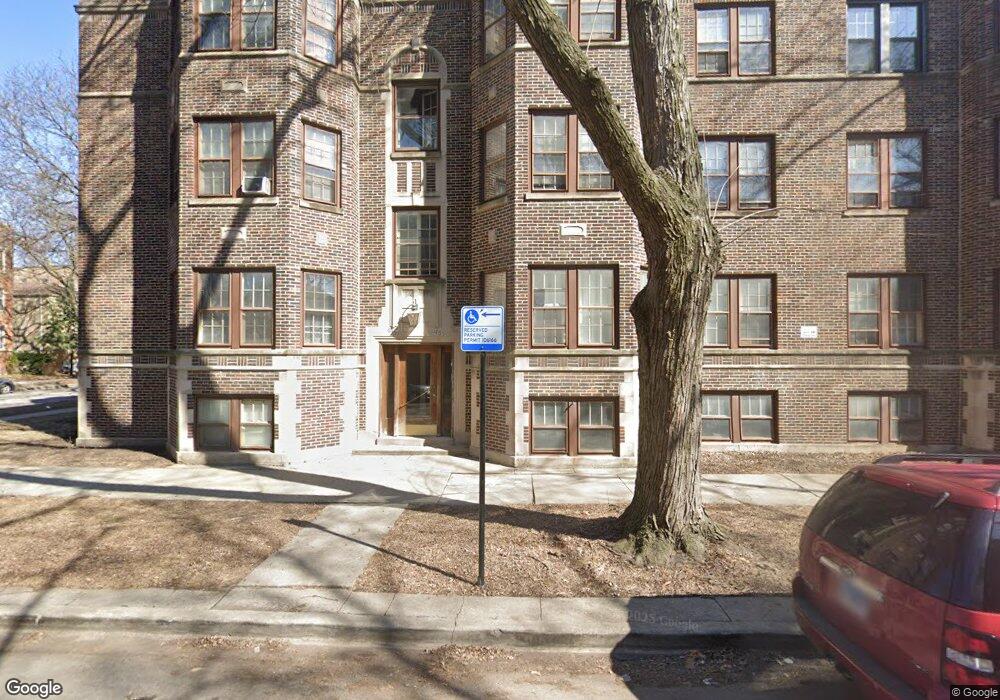
6457 N Bell Ave Unit 64573 Chicago, IL 60645
West Ridge NeighborhoodEstimated Value: $152,000 - $193,015
2
Beds
1
Bath
1,300
Sq Ft
$129/Sq Ft
Est. Value
About This Home
This home is located at 6457 N Bell Ave Unit 64573, Chicago, IL 60645 and is currently estimated at $167,504, approximately $128 per square foot. 6457 N Bell Ave Unit 64573 is a home located in Cook County with nearby schools including George Armstrong Elementary School, Senn High School, and God's Battle Axe Prayer Academy.
Ownership History
Date
Name
Owned For
Owner Type
Purchase Details
Closed on
Nov 18, 2019
Sold by
So Holdings Llc Series Xi
Bought by
So Holdings Llc Series X
Current Estimated Value
Home Financials for this Owner
Home Financials are based on the most recent Mortgage that was taken out on this home.
Original Mortgage
$475,000
Outstanding Balance
$84,479
Interest Rate
4.5%
Mortgage Type
Commercial
Estimated Equity
$83,025
Purchase Details
Closed on
Mar 13, 2019
Sold by
Bushing David and Bushing Mary Bernadette
Bought by
So Holdings Llc Series Xi
Purchase Details
Closed on
Dec 23, 2003
Sold by
Kosiak Donnia M and Kosiak Austin A
Bought by
Bushing David and Bushing Mary Bernadette
Purchase Details
Closed on
Sep 29, 1999
Sold by
Klink Charlotte Kathryn
Bought by
Kosiak Austin A and Kosiak Donnia M
Home Financials for this Owner
Home Financials are based on the most recent Mortgage that was taken out on this home.
Original Mortgage
$60,800
Interest Rate
7.9%
Mortgage Type
Purchase Money Mortgage
Create a Home Valuation Report for This Property
The Home Valuation Report is an in-depth analysis detailing your home's value as well as a comparison with similar homes in the area
Home Values in the Area
Average Home Value in this Area
Purchase History
| Date | Buyer | Sale Price | Title Company |
|---|---|---|---|
| So Holdings Llc Series X | -- | None Available | |
| So Holdings Llc Series Xi | $66,000 | Ata National Title Group Llc | |
| Bushing David | $137,000 | Pntn | |
| Kosiak Austin A | $76,000 | -- |
Source: Public Records
Mortgage History
| Date | Status | Borrower | Loan Amount |
|---|---|---|---|
| Open | So Holdings Llc Series X | $475,000 | |
| Previous Owner | Kosiak Austin A | $60,800 |
Source: Public Records
Tax History Compared to Growth
Tax History
| Year | Tax Paid | Tax Assessment Tax Assessment Total Assessment is a certain percentage of the fair market value that is determined by local assessors to be the total taxable value of land and additions on the property. | Land | Improvement |
|---|---|---|---|---|
| 2024 | $1,477 | $12,837 | $1,341 | $11,496 |
| 2023 | $1,440 | $7,000 | $1,073 | $5,927 |
| 2022 | $1,440 | $7,000 | $1,073 | $5,927 |
| 2021 | $1,407 | $6,999 | $1,072 | $5,927 |
| 2020 | $912 | $4,094 | $1,013 | $3,081 |
| 2019 | $913 | $4,542 | $1,013 | $3,529 |
| 2018 | $897 | $4,542 | $1,013 | $3,529 |
| 2017 | $1,097 | $5,095 | $894 | $4,201 |
| 2016 | $1,020 | $5,095 | $894 | $4,201 |
| 2015 | $934 | $5,095 | $894 | $4,201 |
| 2014 | $1,184 | $6,379 | $804 | $5,575 |
| 2013 | $1,160 | $6,379 | $804 | $5,575 |
Source: Public Records
Map
Nearby Homes
- 2111 W Arthur Ave Unit 1S
- 6414 N Hoyne Ave Unit 3W
- 2205 W Highland Ave Unit 2N
- 6318 N Bell Ave
- 2320 W Rosemont Ave Unit 1
- 6423 N Seeley Ave
- 6246 N Oakley Ave
- 2218 W Thome Ave Unit 3N
- 6561 N Seeley Ave
- 6609 N Artesian Ave
- 6319 N Artesian Ave Unit 3W
- 6433 N Damen Ave Unit 3E
- 6431 N Damen Ave Unit 2E
- 2300 W Granville Ave Unit G
- 2338 W Granville Ave Unit 2
- 6500 N Ridge Blvd Unit 4E
- 6400 N Ridge Blvd Unit 203
- 2217 W Farwell Ave Unit 3B
- 2217 W Farwell Ave Unit 2B
- 2241 W Farwell Ave Unit 2D
- 6457 N Bell Ave Unit 3N
- 6457 N Bell Ave Unit 1N
- 6457 N Bell Ave Unit 2N
- 6457 N Bell Ave Unit 64571
- 6457 N Bell Ave Unit BSMT
- 6455 N Bell Ave Unit 64553
- 6455 N Bell Ave Unit 64552
- 6455 N Bell Ave Unit 64551
- 6455 N Bell Ave Unit 1
- 2223 W Arthur Ave Unit 6457-2
- 6451 N Bell Ave Unit 64511
- 6451 N Bell Ave Unit 64512
- 2221 W Arthur Ave Unit 2
- 2221 W Arthur Ave Unit 22211
- 2221 W Arthur Ave Unit 22212
- 2221 W Arthur Ave Unit 64491
- 2221 W Arthur Ave Unit 22213
- 2221 W Arthur Ave Unit 2W
- 2221 W Arthur Ave
- 2221 W Arthur Ave Unit 3