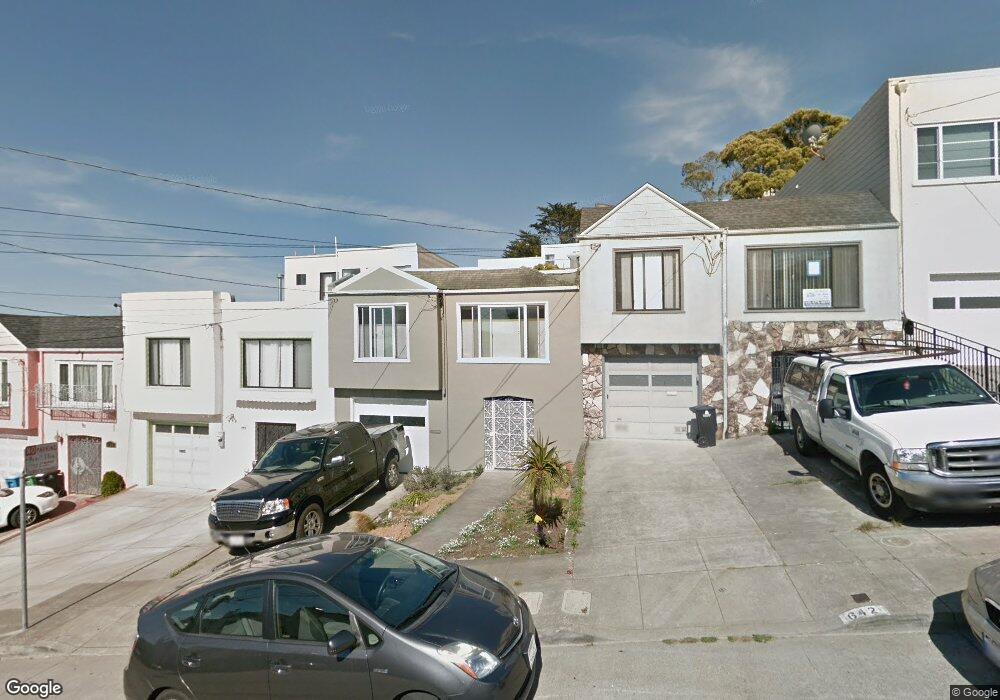
646 Head St San Francisco, CA 94132
Merced Heights NeighborhoodEstimated Value: $895,000 - $1,277,000
--
Bed
1
Bath
1,050
Sq Ft
$1,004/Sq Ft
Est. Value
About This Home
This home is located at 646 Head St, San Francisco, CA 94132 and is currently estimated at $1,054,654, approximately $1,004 per square foot. 646 Head St is a home located in San Francisco County with nearby schools including Ortega (Jose) Elementary School, Aptos Middle School, and Stratford School.
Ownership History
Date
Name
Owned For
Owner Type
Purchase Details
Closed on
Oct 1, 1999
Sold by
Goode Mary A Revocable Tr 1997 and Mary A
Bought by
Bell Gordon I and Evind Joanne
Current Estimated Value
Home Financials for this Owner
Home Financials are based on the most recent Mortgage that was taken out on this home.
Original Mortgage
$236,000
Outstanding Balance
$68,105
Interest Rate
7.25%
Estimated Equity
$986,549
Purchase Details
Closed on
May 1, 1997
Sold by
Goode Mary A
Bought by
Goode Mary A
Create a Home Valuation Report for This Property
The Home Valuation Report is an in-depth analysis detailing your home's value as well as a comparison with similar homes in the area
Home Values in the Area
Average Home Value in this Area
Purchase History
| Date | Buyer | Sale Price | Title Company |
|---|---|---|---|
| Bell Gordon I | $295,000 | First American Title Co | |
| Goode Mary A | -- | -- |
Source: Public Records
Mortgage History
| Date | Status | Borrower | Loan Amount |
|---|---|---|---|
| Open | Bell Gordon I | $236,000 | |
| Closed | Bell Gordon I | $44,250 |
Source: Public Records
Tax History Compared to Growth
Tax History
| Year | Tax Paid | Tax Assessment Tax Assessment Total Assessment is a certain percentage of the fair market value that is determined by local assessors to be the total taxable value of land and additions on the property. | Land | Improvement |
|---|---|---|---|---|
| 2025 | $5,996 | $453,384 | $268,959 | $184,425 |
| 2024 | $5,996 | $444,495 | $263,686 | $180,809 |
| 2023 | $5,898 | $435,780 | $258,516 | $177,264 |
| 2022 | $5,773 | $427,237 | $253,448 | $173,789 |
| 2021 | $5,667 | $418,861 | $248,479 | $170,382 |
| 2020 | $5,759 | $414,567 | $245,932 | $168,635 |
| 2019 | $5,517 | $406,439 | $241,110 | $165,329 |
| 2018 | $5,333 | $398,471 | $236,383 | $162,088 |
| 2017 | $4,972 | $390,659 | $231,749 | $158,910 |
| 2016 | $4,868 | $383,000 | $227,205 | $155,795 |
| 2015 | $4,807 | $377,248 | $223,793 | $153,455 |
| 2014 | $4,681 | $369,860 | $219,410 | $150,450 |
Source: Public Records
Map
Nearby Homes