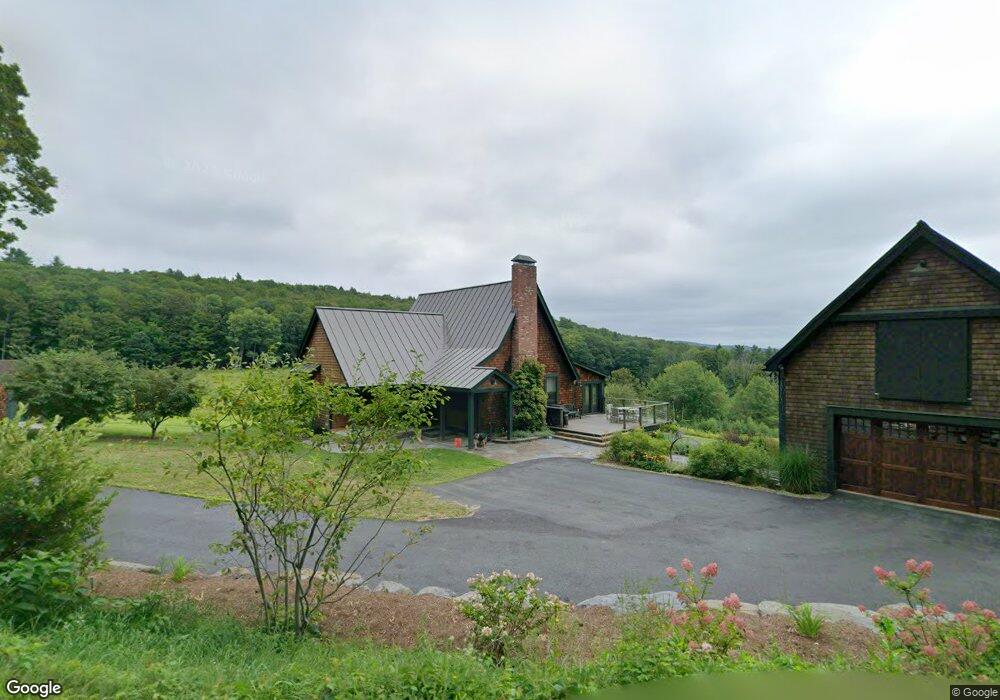
65 Avery Rd Charlemont, MA 01339
Buckland NeighborhoodEstimated Value: $797,582 - $1,282,000
2
Beds
3
Baths
2,192
Sq Ft
$452/Sq Ft
Est. Value
About This Home
This home is located at 65 Avery Rd, Charlemont, MA 01339 and is currently estimated at $990,194, approximately $451 per square foot. 65 Avery Rd is a home located in Franklin County with nearby schools including Mohawk Trail Regional High School.
Ownership History
Date
Name
Owned For
Owner Type
Purchase Details
Closed on
Apr 16, 2013
Sold by
Georgantas Laura M
Bought by
Georgantas James M
Current Estimated Value
Purchase Details
Closed on
Oct 18, 2006
Sold by
Georgantas James M and Georgantas Laura M
Bought by
Georgantas James M and Georgantas Laura M
Purchase Details
Closed on
Feb 10, 2005
Sold by
Georgantas James M and Georgantas James
Bought by
Georgantas James M and Georgantas Laura M
Create a Home Valuation Report for This Property
The Home Valuation Report is an in-depth analysis detailing your home's value as well as a comparison with similar homes in the area
Home Values in the Area
Average Home Value in this Area
Purchase History
| Date | Buyer | Sale Price | Title Company |
|---|---|---|---|
| Georgantas James M | -- | -- | |
| Georgantas James M | -- | -- | |
| Georgantas James M | -- | -- | |
| Georgantas James M | -- | -- | |
| Georgantas James M | -- | -- |
Source: Public Records
Tax History Compared to Growth
Tax History
| Year | Tax Paid | Tax Assessment Tax Assessment Total Assessment is a certain percentage of the fair market value that is determined by local assessors to be the total taxable value of land and additions on the property. | Land | Improvement |
|---|---|---|---|---|
| 2025 | $11,646 | $687,493 | $109,693 | $577,800 |
| 2024 | $10,227 | $582,387 | $109,387 | $473,000 |
| 2023 | $9,466 | $558,798 | $108,898 | $449,900 |
| 2022 | $9,377 | $558,798 | $108,898 | $449,900 |
| 2021 | $8,571 | $480,433 | $108,633 | $371,800 |
| 2020 | $3,903 | $444,733 | $108,633 | $336,100 |
| 2019 | $7,811 | $419,278 | $108,578 | $310,700 |
| 2018 | $3,670 | $404,389 | $108,689 | $295,700 |
| 2017 | $7,112 | $394,038 | $109,038 | $285,000 |
| 2016 | $4,987 | $295,110 | $108,410 | $186,700 |
| 2015 | $4,909 | $292,210 | $108,410 | $183,800 |
Source: Public Records
Map
Nearby Homes