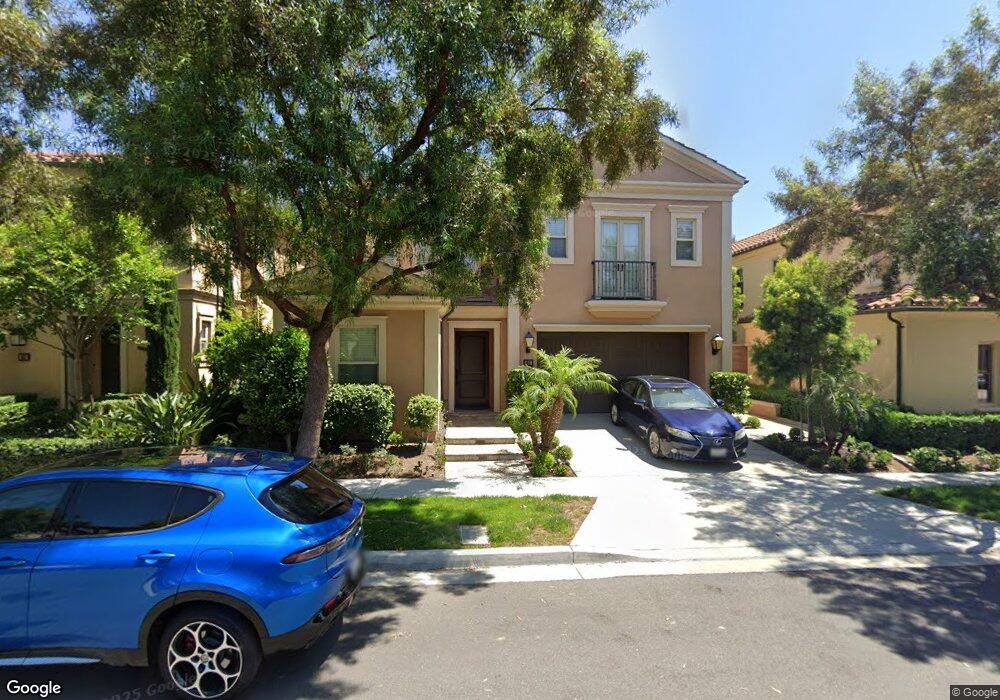
65 Crestwick Irvine, CA 92620
Woodbury and Stonegate NeighborhoodEstimated Value: $2,240,000 - $2,468,000
4
Beds
3
Baths
2,613
Sq Ft
$895/Sq Ft
Est. Value
About This Home
This home is located at 65 Crestwick, Irvine, CA 92620 and is currently estimated at $2,338,906, approximately $895 per square foot. 65 Crestwick is a home with nearby schools including Stonegate Elementary School, Sierra Vista Middle School, and Northwood High School.
Ownership History
Date
Name
Owned For
Owner Type
Purchase Details
Closed on
Nov 6, 2015
Sold by
Chung Wayne Chengwen and Chung Ching Hua
Bought by
Chung Wayne Chengwen and Ching Hua Chung Revocable Trust
Current Estimated Value
Purchase Details
Closed on
Jan 30, 2015
Sold by
Irvine Pacific Lp
Bought by
Chung Wayne Chengwen and Chung Ching Hua
Home Financials for this Owner
Home Financials are based on the most recent Mortgage that was taken out on this home.
Original Mortgage
$753,000
Interest Rate
2.75%
Mortgage Type
Adjustable Rate Mortgage/ARM
Create a Home Valuation Report for This Property
The Home Valuation Report is an in-depth analysis detailing your home's value as well as a comparison with similar homes in the area
Home Values in the Area
Average Home Value in this Area
Purchase History
| Date | Buyer | Sale Price | Title Company |
|---|---|---|---|
| Chung Wayne Chengwen | -- | None Available | |
| Chung Wayne Chengwen | $1,077,000 | First American Title Company | |
| Irvine Pacific Lp | -- | First American Title Company |
Source: Public Records
Mortgage History
| Date | Status | Borrower | Loan Amount |
|---|---|---|---|
| Previous Owner | Chung Wayne Chengwen | $753,000 |
Source: Public Records
Tax History
| Year | Tax Paid | Tax Assessment Tax Assessment Total Assessment is a certain percentage of the fair market value that is determined by local assessors to be the total taxable value of land and additions on the property. | Land | Improvement |
|---|---|---|---|---|
| 2025 | $17,162 | $1,318,165 | $800,731 | $517,434 |
| 2024 | $17,162 | $1,292,319 | $785,030 | $507,289 |
| 2023 | $16,869 | $1,266,980 | $769,637 | $497,343 |
| 2022 | $16,614 | $1,242,138 | $754,546 | $487,592 |
| 2021 | $16,356 | $1,217,783 | $739,751 | $478,032 |
| 2020 | $16,721 | $1,205,297 | $732,166 | $473,131 |
| 2019 | $16,658 | $1,181,664 | $717,810 | $463,854 |
| 2018 | $16,511 | $1,158,495 | $703,736 | $454,759 |
| 2017 | $16,269 | $1,135,780 | $689,937 | $445,843 |
| 2016 | $15,553 | $1,093,090 | $676,409 | $416,681 |
| 2015 | $7,986 | $350,343 | $1,488 | $348,855 |
| 2014 | -- | $1,459 | $1,459 | $0 |
Source: Public Records
Map
Nearby Homes
Your Personal Tour Guide
Ask me questions while you tour the home.