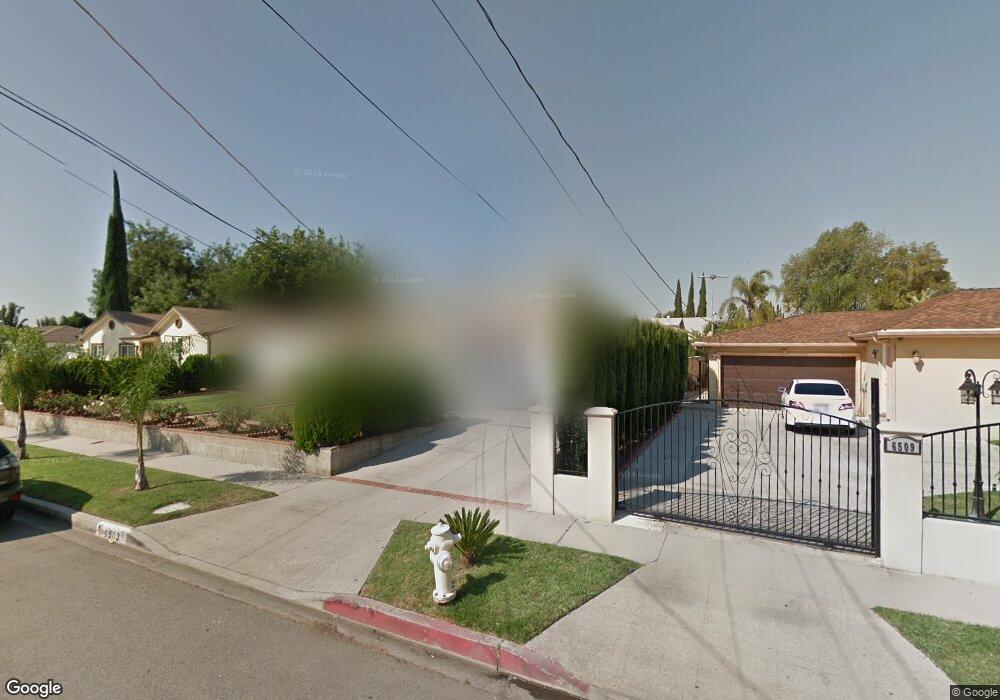
6503 Nagle Ave van Nuys, CA 91401
Estimated Value: $962,000 - $1,708,692
6
Beds
6
Baths
3,759
Sq Ft
$353/Sq Ft
Est. Value
About This Home
This home is located at 6503 Nagle Ave, van Nuys, CA 91401 and is currently estimated at $1,326,423, approximately $352 per square foot. 6503 Nagle Ave is a home located in Los Angeles County with nearby schools including Kittridge Street Elementary, James Madison Middle, and Ulysses S. Grant Senior High School.
Ownership History
Date
Name
Owned For
Owner Type
Purchase Details
Closed on
Aug 10, 2010
Sold by
Yedalyan Harutyun
Bought by
Yedalyan Harutyun
Current Estimated Value
Home Financials for this Owner
Home Financials are based on the most recent Mortgage that was taken out on this home.
Original Mortgage
$300,000
Outstanding Balance
$198,128
Interest Rate
4.52%
Mortgage Type
New Conventional
Estimated Equity
$1,128,295
Purchase Details
Closed on
Jun 10, 2003
Sold by
Yedalyan Ignatios and Yedalyan Zhanna
Bought by
Yedalyan Harutyun
Purchase Details
Closed on
May 10, 1995
Sold by
Swankie Ian David and The Swankie Trust
Bought by
Yedalyan Ignatios
Home Financials for this Owner
Home Financials are based on the most recent Mortgage that was taken out on this home.
Original Mortgage
$128,000
Interest Rate
8.47%
Create a Home Valuation Report for This Property
The Home Valuation Report is an in-depth analysis detailing your home's value as well as a comparison with similar homes in the area
Home Values in the Area
Average Home Value in this Area
Purchase History
| Date | Buyer | Sale Price | Title Company |
|---|---|---|---|
| Yedalyan Harutyun | -- | Fidelity National Title Co | |
| Yedalyan Harutyun | -- | Fidelity National Title Co | |
| Yedalyan Harutyun | -- | -- | |
| Yedalyan Ignatios | $160,000 | Equity Title Company |
Source: Public Records
Mortgage History
| Date | Status | Borrower | Loan Amount |
|---|---|---|---|
| Open | Yedalyan Harutyun | $300,000 | |
| Closed | Yedalyan Harutyun | $300,000 | |
| Closed | Yedalyan Ignatios | $128,000 |
Source: Public Records
Tax History Compared to Growth
Tax History
| Year | Tax Paid | Tax Assessment Tax Assessment Total Assessment is a certain percentage of the fair market value that is determined by local assessors to be the total taxable value of land and additions on the property. | Land | Improvement |
|---|---|---|---|---|
| 2025 | $6,916 | $546,781 | $120,250 | $426,531 |
| 2024 | $6,916 | $536,061 | $117,893 | $418,168 |
| 2023 | $6,788 | $525,551 | $115,582 | $409,969 |
| 2022 | $6,484 | $515,247 | $113,316 | $401,931 |
| 2021 | $6,386 | $505,145 | $111,095 | $394,050 |
| 2019 | $6,200 | $490,163 | $107,800 | $382,363 |
| 2018 | $5,997 | $480,553 | $105,687 | $374,866 |
| 2016 | $3,403 | $275,086 | $101,584 | $173,502 |
| 2015 | $3,354 | $270,955 | $100,059 | $170,896 |
| 2014 | $3,373 | $265,648 | $98,099 | $167,549 |
Source: Public Records
Map
Nearby Homes
- 13350 Victory Blvd
- 6535 Mary Ellen Ave
- 6332 Fulton Ave Unit 109
- 6250 Fulton Ave Unit 104
- 6539 Ventura Canyon Ave
- 6723 Sunnyslope Ave
- 13226 Vanowen St
- 13600 Sylvan St
- 13633 Sylvan St
- 6134 Longridge Ave
- 13001 Debby St
- 6101 Fulton Ave Unit 8
- 6255 Woodman Ave Unit 203
- 13127 Hartland St
- 13061 Vanowen St
- 6342 Morse Ave Unit 207
- 6342 Morse Ave Unit 205
- 6227 Morse Ave Unit 307
- 6247 Morse Ave
- 13455 Bassett St