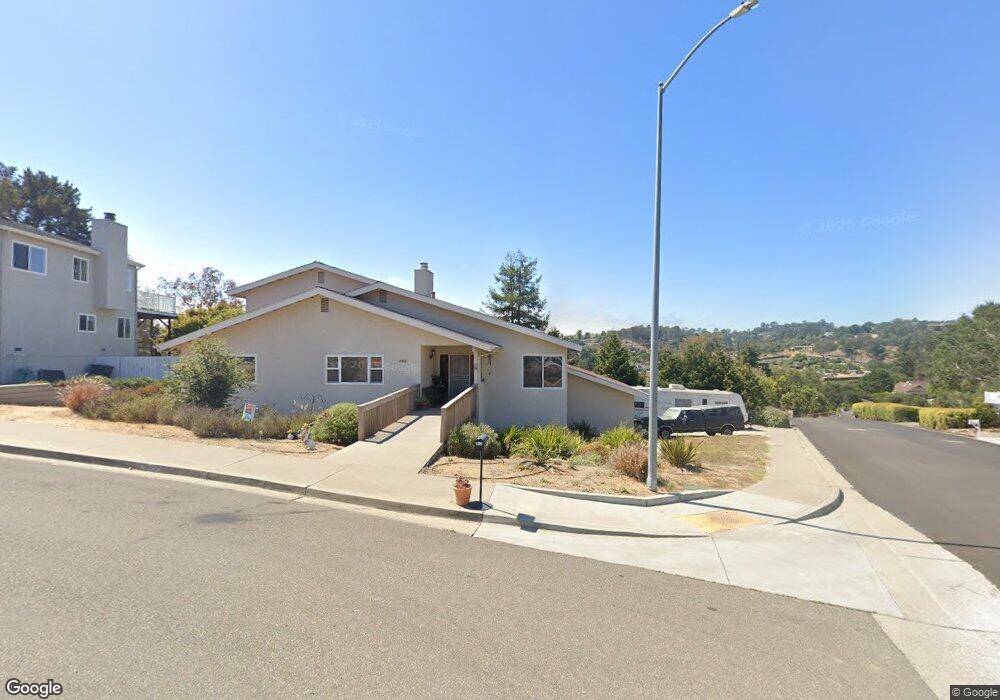
653 Corral Place Arroyo Grande, CA 93420
Estimated Value: $1,054,000 - $1,269,000
3
Beds
2
Baths
1,713
Sq Ft
$671/Sq Ft
Est. Value
About This Home
This home is located at 653 Corral Place, Arroyo Grande, CA 93420 and is currently estimated at $1,149,222, approximately $670 per square foot. 653 Corral Place is a home located in San Luis Obispo County with nearby schools including Ocean View Elementary School, Paulding Middle School, and Arroyo Grande High School.
Ownership History
Date
Name
Owned For
Owner Type
Purchase Details
Closed on
Nov 10, 2010
Sold by
Bankunited
Bought by
Zagrzebski Richard Lee and Zagrzebski Briana
Current Estimated Value
Home Financials for this Owner
Home Financials are based on the most recent Mortgage that was taken out on this home.
Original Mortgage
$405,750
Outstanding Balance
$266,477
Interest Rate
4.18%
Mortgage Type
New Conventional
Estimated Equity
$882,745
Purchase Details
Closed on
Sep 3, 2010
Sold by
Lostaunau Debra L and Lostaunau Victor R
Bought by
Bankunited
Purchase Details
Closed on
Jun 10, 2005
Sold by
Ford Frank G
Bought by
Lostaunau Victor R and Lostaunau Debra L
Home Financials for this Owner
Home Financials are based on the most recent Mortgage that was taken out on this home.
Original Mortgage
$420,000
Interest Rate
7.75%
Mortgage Type
Fannie Mae Freddie Mac
Create a Home Valuation Report for This Property
The Home Valuation Report is an in-depth analysis detailing your home's value as well as a comparison with similar homes in the area
Home Values in the Area
Average Home Value in this Area
Purchase History
| Date | Buyer | Sale Price | Title Company |
|---|---|---|---|
| Zagrzebski Richard Lee | $541,000 | Lsi Title Company Inc | |
| Bankunited | $545,000 | Accommodation | |
| Lostaunau Victor R | $700,000 | Cuesta Title Company |
Source: Public Records
Mortgage History
| Date | Status | Borrower | Loan Amount |
|---|---|---|---|
| Open | Zagrzebski Richard Lee | $405,750 | |
| Previous Owner | Lostaunau Victor R | $420,000 |
Source: Public Records
Tax History Compared to Growth
Tax History
| Year | Tax Paid | Tax Assessment Tax Assessment Total Assessment is a certain percentage of the fair market value that is determined by local assessors to be the total taxable value of land and additions on the property. | Land | Improvement |
|---|---|---|---|---|
| 2025 | $7,096 | $693,105 | $435,594 | $257,511 |
| 2024 | $7,013 | $679,515 | $427,053 | $252,462 |
| 2023 | $7,013 | $666,192 | $418,680 | $247,512 |
| 2022 | $6,906 | $653,130 | $410,471 | $242,659 |
| 2021 | $7,235 | $640,324 | $402,423 | $237,901 |
| 2020 | $6,811 | $633,759 | $398,297 | $235,462 |
| 2019 | $6,761 | $621,334 | $390,488 | $230,846 |
| 2018 | $6,678 | $609,152 | $382,832 | $226,320 |
| 2017 | $6,566 | $597,209 | $375,326 | $221,883 |
| 2016 | $6,202 | $585,500 | $367,967 | $217,533 |
| 2015 | $6,149 | $576,706 | $362,440 | $214,266 |
| 2014 | $5,924 | $565,410 | $355,341 | $210,069 |
Source: Public Records
Map
Nearby Homes
- 210 Acero Place
- 807 Plata Rd
- 950 Huasna Rd Unit 41
- 950 Huasna Rd Unit 20
- 555 Le Point St
- 547 May St
- 1130 Vard Loomis Ln
- 212 Miller Way
- 604 Hillside Ct
- 267 Mercedes Ln
- 324 Short St
- 289 Mercedes Ln
- 553 Rosemary Ln
- 649 Asilo
- 413 Via Bandolero
- 515 Windermere Ln
- 1155 Carpenter Canyon Rd
- 432 California St
- 411 Cornwall Ave
- 414 E Grand Ave