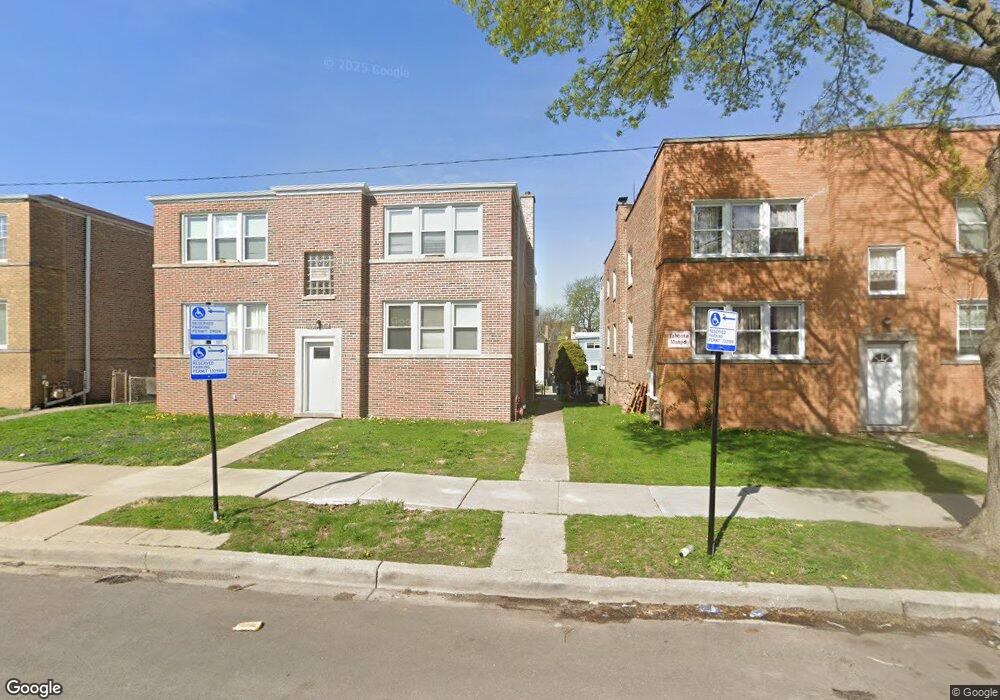
6532 N Seeley Ave Unit 65321 Chicago, IL 60645
West Ridge NeighborhoodEstimated Value: $182,563 - $238,000
2
Beds
1
Bath
1,000
Sq Ft
$210/Sq Ft
Est. Value
About This Home
This home is located at 6532 N Seeley Ave Unit 65321, Chicago, IL 60645 and is currently estimated at $210,391, approximately $210 per square foot. 6532 N Seeley Ave Unit 65321 is a home located in Cook County with nearby schools including George Armstrong Elementary School, Senn High School, and God's Battle Axe Prayer Academy.
Ownership History
Date
Name
Owned For
Owner Type
Purchase Details
Closed on
Dec 11, 2023
Sold by
Mumith Rejina A
Bought by
Mumith Mohammed A
Current Estimated Value
Purchase Details
Closed on
Jun 1, 2013
Sold by
Akhtar Parves
Bought by
Mumith Regina A
Purchase Details
Closed on
Jul 15, 2011
Sold by
Mumith Mohammed A and Mumith Regina A
Bought by
Akhtar Parves
Purchase Details
Closed on
Nov 28, 2000
Sold by
Shah Rakesh and Shah Nita
Bought by
Mumith Mohammed A
Home Financials for this Owner
Home Financials are based on the most recent Mortgage that was taken out on this home.
Original Mortgage
$97,600
Interest Rate
7.7%
Purchase Details
Closed on
Oct 1, 1997
Sold by
Lasalle National Bank
Bought by
Nitz Shah Rakesh and Nitz Shah
Create a Home Valuation Report for This Property
The Home Valuation Report is an in-depth analysis detailing your home's value as well as a comparison with similar homes in the area
Home Values in the Area
Average Home Value in this Area
Purchase History
| Date | Buyer | Sale Price | Title Company |
|---|---|---|---|
| Mumith Mohammed A | -- | None Listed On Document | |
| Mumith Regina A | -- | None Available | |
| Akhtar Parves | $38,000 | First American Title | |
| Mumith Mohammed A | $122,000 | -- | |
| Nitz Shah Rakesh | -- | -- |
Source: Public Records
Mortgage History
| Date | Status | Borrower | Loan Amount |
|---|---|---|---|
| Previous Owner | Mumith Mohammed A | $97,600 |
Source: Public Records
Tax History Compared to Growth
Tax History
| Year | Tax Paid | Tax Assessment Tax Assessment Total Assessment is a certain percentage of the fair market value that is determined by local assessors to be the total taxable value of land and additions on the property. | Land | Improvement |
|---|---|---|---|---|
| 2024 | $850 | $13,000 | $3,516 | $9,484 |
| 2023 | $1,559 | $11,001 | $2,813 | $8,188 |
| 2022 | $1,559 | $11,001 | $2,813 | $8,188 |
| 2021 | $1,542 | $10,999 | $2,812 | $8,187 |
| 2020 | $2,175 | $12,864 | $2,656 | $10,208 |
| 2019 | $2,178 | $14,270 | $2,656 | $11,614 |
| 2018 | $2,140 | $14,270 | $2,656 | $11,614 |
| 2017 | $2,129 | $13,264 | $2,343 | $10,921 |
| 2016 | $2,157 | $13,264 | $2,343 | $10,921 |
| 2015 | $1,950 | $13,264 | $2,343 | $10,921 |
| 2014 | $2,393 | $12,900 | $2,109 | $10,791 |
| 2013 | $2,346 | $12,900 | $2,109 | $10,791 |
Source: Public Records
Map
Nearby Homes
- 6561 N Seeley Ave
- 2025 W Arthur Ave Unit C2
- 2111 W Arthur Ave Unit 1S
- 6433 N Damen Ave Unit 3E
- 6414 N Hoyne Ave Unit 3W
- 6421 N Damen Ave Unit 1W
- 6500 N Ridge Blvd Unit 4E
- 6423 N Leavitt St
- 6457 N Bell Ave Unit 2
- 7518 N Ridge Ave Unit 1E
- 1937 W Pratt Blvd Unit 2N
- 2205 W Highland Ave Unit 2N
- 2065 W Farwell Ave Unit 20653N
- 6801 N Wolcott Ave
- 2257 W Rosemont Ave Unit 1
- 1749 W North Shore Ave
- 1745 W North Shore Ave
- 2217 W Farwell Ave Unit 2B
- 2130 W Farwell Ave
- 2320 W Rosemont Ave Unit 1
- 6532 N Seeley Ave Unit 65322
- 6532 N Seeley Ave Unit 1N
- 6530 N Seeley Ave Unit 65301
- 6530 N Seeley Ave Unit 65302
- 6526 N Seeley Ave
- 6534 N Seeley Ave Unit 1S
- 6536 N Seeley Ave Unit 1N
- 6536 N Seeley Ave Unit 2N
- 6534 N Seeley Ave Unit 2S
- 6522 N Seeley Ave Unit 65221
- 6522 N Seeley Ave Unit 2
- 6540 N Seeley Ave
- 6540 N Seeley Ave Unit 1S
- 6540 N Seeley Ave Unit 1N
- 6520 N Seeley Ave Unit 2S
- 6520 N Seeley Ave Unit 65202
- 6520 N Seeley Ave Unit 65201
- 6520 N Seeley Ave Unit 65222
- 6544 N Seeley Ave Unit 2
- 6544 N Seeley Ave Unit 4