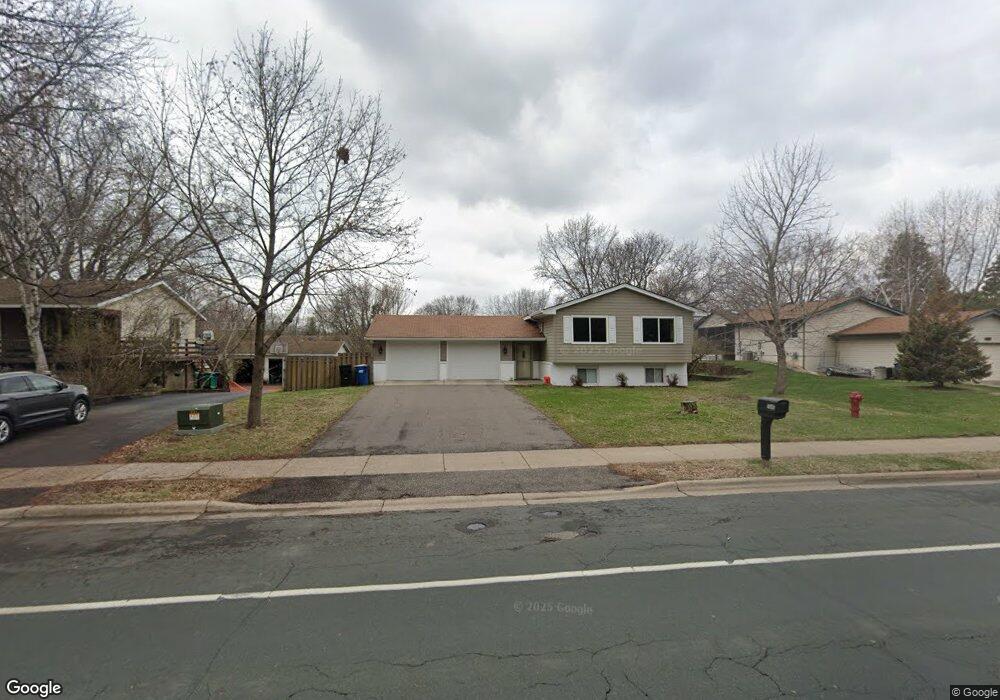
6545 E Fish Lake Rd Maple Grove, MN 55369
Estimated Value: $379,000 - $403,831
4
Beds
2
Baths
2,353
Sq Ft
$167/Sq Ft
Est. Value
About This Home
This home is located at 6545 E Fish Lake Rd, Maple Grove, MN 55369 and is currently estimated at $393,958, approximately $167 per square foot. 6545 E Fish Lake Rd is a home located in Hennepin County with nearby schools including Cedar Island Elementary School, Maple Grove Middle School, and Osseo Senior High School.
Ownership History
Date
Name
Owned For
Owner Type
Purchase Details
Closed on
Jul 20, 2020
Sold by
Demeuse Fred and Demeuse Kari
Bought by
Obermiller Anne C and Obermiller Nate J
Current Estimated Value
Home Financials for this Owner
Home Financials are based on the most recent Mortgage that was taken out on this home.
Original Mortgage
$288,000
Outstanding Balance
$254,901
Interest Rate
3%
Estimated Equity
$139,057
Purchase Details
Closed on
Oct 28, 2005
Sold by
Brown Patrick W and Brown Heidi L
Bought by
Demeuse Frederick and Demeuse Kari
Purchase Details
Closed on
May 24, 2002
Sold by
Moench Carol
Bought by
Janke Heidi L and Brown Patrick W
Purchase Details
Closed on
Jun 30, 1998
Sold by
Johnson Ward C and Johnson Karen S
Bought by
Haala Wilbert W and Hansen Carol
Create a Home Valuation Report for This Property
The Home Valuation Report is an in-depth analysis detailing your home's value as well as a comparison with similar homes in the area
Home Values in the Area
Average Home Value in this Area
Purchase History
| Date | Buyer | Sale Price | Title Company |
|---|---|---|---|
| Obermiller Anne C | $360,000 | Edina Realty Title Inc | |
| Demeuse Frederick | $285,900 | -- | |
| Janke Heidi L | $180,000 | -- | |
| Haala Wilbert W | $128,900 | -- |
Source: Public Records
Mortgage History
| Date | Status | Borrower | Loan Amount |
|---|---|---|---|
| Open | Obermiller Anne C | $288,000 |
Source: Public Records
Tax History
| Year | Tax Paid | Tax Assessment Tax Assessment Total Assessment is a certain percentage of the fair market value that is determined by local assessors to be the total taxable value of land and additions on the property. | Land | Improvement |
|---|---|---|---|---|
| 2024 | $4,366 | $368,600 | $123,300 | $245,300 |
| 2023 | $4,230 | $363,800 | $114,900 | $248,900 |
| 2022 | $3,522 | $374,200 | $112,000 | $262,200 |
| 2021 | $3,461 | $298,200 | $70,200 | $228,000 |
| 2020 | $3,601 | $287,900 | $70,200 | $217,700 |
| 2019 | $3,461 | $286,300 | $79,300 | $207,000 |
| 2018 | $3,207 | $262,200 | $66,300 | $195,900 |
| 2017 | $3,171 | $230,100 | $60,000 | $170,100 |
| 2016 | $3,350 | $238,300 | $73,000 | $165,300 |
| 2015 | $3,022 | $212,300 | $57,000 | $155,300 |
| 2014 | -- | $201,500 | $59,500 | $142,000 |
Source: Public Records
Map
Nearby Homes
- 6502 Ives Ln N
- 6686 Ives Ln N
- 6340 Larch Ln N
- 12070 Meadowlark Ct
- 6904 Ives Ln N
- 12500 69th Ave N
- 6942 Ives Ln N
- 6220 Kirkwood Ln N
- 6802 Cottonwood Ln N
- 6806 Deerwood Ln N
- 12060 71st Place N
- 11081 69th Ave N
- 6040 Goldenrod Ln N
- 10947 69th Ave N
- 11313 71st Ave N
- 11053 N Eagle Lake Blvd
- 5933 Forestview Ln N
- 5812 Forestview Ln N
- 6826 Berkshire Ln N
- 6245 Annapolis Ln N
- 6531 E Fish Lake Rd
- 6567 E Fish Lake Rd
- 6542 Bluebird Dr
- 6523 E Fish Lake Rd
- 6575 E Fish Lake Rd
- 6554 Bluebird Dr
- 6534 Bluebird Dr
- 6566 Bluebird Dr
- 6575 Jonquil Way
- 6526 Bluebird Dr
- 6517 E Fish Lake Rd
- 6581 E Fish Lake Rd
- 6580 E Fish Lake Rd
- 6588 Bluebird Dr
- 6514 Bluebird Dr
- 6588 Jonquil Way
- 6592 Jonquil Way
- 6589 E Fish Lake Rd
- 6509 E Fish Lake Rd
- 6590 E Fish Lake Rd
Your Personal Tour Guide
Ask me questions while you tour the home.