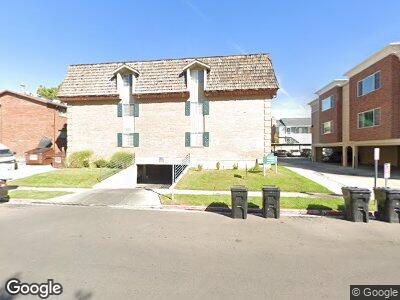
655 E 600 N Unit 8 Provo, UT 84606
Joaquin NeighborhoodEstimated Value: $372,000 - $411,000
2
Beds
2
Baths
1,100
Sq Ft
$352/Sq Ft
Est. Value
About This Home
This home is located at 655 E 600 N Unit 8, Provo, UT 84606 and is currently estimated at $387,001, approximately $351 per square foot. 655 E 600 N Unit 8 is a home located in Utah County with nearby schools including Provo Peaks School, Centennial Middle School, and Timpview High School.
Ownership History
Date
Name
Owned For
Owner Type
Purchase Details
Closed on
Oct 22, 2020
Sold by
Bairett Richard Lee and Bairett Crista Lee
Bought by
Hansen Kent B and Hansen Paula P
Current Estimated Value
Purchase Details
Closed on
Aug 13, 2013
Sold by
Broadbent David H and Broadbent Michele E
Bought by
Bairett Richard Lee and Bairett Crista Lee
Home Financials for this Owner
Home Financials are based on the most recent Mortgage that was taken out on this home.
Original Mortgage
$137,250
Interest Rate
4.28%
Mortgage Type
New Conventional
Purchase Details
Closed on
Jan 26, 2004
Sold by
Broadbent David H and Broadbent Michele E
Bought by
Broadbent David H and Broadbent Michele E
Home Financials for this Owner
Home Financials are based on the most recent Mortgage that was taken out on this home.
Original Mortgage
$76,300
Interest Rate
5.79%
Mortgage Type
FHA
Purchase Details
Closed on
Oct 8, 1999
Sold by
Broadbent Anne Elizabeth
Bought by
Broadbent David H and Broadbent Michele E
Create a Home Valuation Report for This Property
The Home Valuation Report is an in-depth analysis detailing your home's value as well as a comparison with similar homes in the area
Home Values in the Area
Average Home Value in this Area
Purchase History
| Date | Buyer | Sale Price | Title Company |
|---|---|---|---|
| Hansen Kent B | -- | Us Title Insurance Agency | |
| Bairett Richard Lee | -- | First American Title Compa | |
| Bailey Anne Elizabeth | -- | First American Title Company | |
| Broadbent David H | -- | Title West Title Company | |
| Broadbent David H | -- | -- |
Source: Public Records
Mortgage History
| Date | Status | Borrower | Loan Amount |
|---|---|---|---|
| Previous Owner | Bairett Richard Lee | $137,250 | |
| Previous Owner | Broadbent David H | $76,300 |
Source: Public Records
Tax History Compared to Growth
Tax History
| Year | Tax Paid | Tax Assessment Tax Assessment Total Assessment is a certain percentage of the fair market value that is determined by local assessors to be the total taxable value of land and additions on the property. | Land | Improvement |
|---|---|---|---|---|
| 2024 | $1,885 | $185,405 | $0 | $0 |
| 2023 | $1,885 | $182,875 | $0 | $0 |
| 2022 | $2,107 | $206,195 | $0 | $0 |
| 2021 | $1,771 | $302,300 | $36,300 | $266,000 |
| 2020 | $1,747 | $279,500 | $33,500 | $246,000 |
| 2019 | $1,521 | $253,000 | $32,900 | $220,100 |
| 2018 | $1,304 | $220,000 | $27,000 | $193,000 |
| 2017 | $1,129 | $104,665 | $0 | $0 |
| 2016 | $1,101 | $95,150 | $0 | $0 |
| 2015 | $944 | $82,500 | $0 | $0 |
| 2014 | $906 | $82,500 | $0 | $0 |
Source: Public Records
Map
Nearby Homes
- 837 E 620 N Unit K4
- 421 N 800 E
- 419 N 500 E Unit 102
- 1005 E 560 N
- 379 N 500 E
- 289 N 700 E
- 440 N 300 E
- 675 N 1130 E
- 334 N 1020 E
- 261 N 400 E Unit 103
- 161 E 700 N Unit 10
- 993 E 200 N
- 1235 E 820 N
- 1302 E 610 N
- 812 Hillsdale Ln
- 639 N University Ave Unit 2
- 639 N University Ave Unit 10
- 820 E Center St
- 1341 E 720 N
- 1586 E 720 N Unit 1075