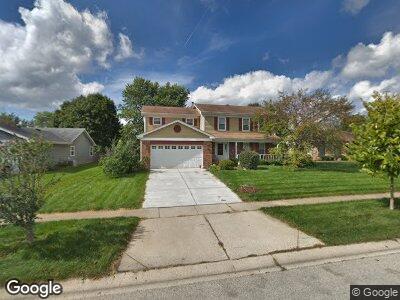
655 Fox Run Ln Algonquin, IL 60102
Estimated Value: $394,000 - $432,000
4
Beds
3
Baths
2,145
Sq Ft
$195/Sq Ft
Est. Value
About This Home
This home is located at 655 Fox Run Ln, Algonquin, IL 60102 and is currently estimated at $419,308, approximately $195 per square foot. 655 Fox Run Ln is a home located in McHenry County with nearby schools including Algonquin Lakes Elementary School, Algonquin Middle School, and Dundee-Crown High School.
Ownership History
Date
Name
Owned For
Owner Type
Purchase Details
Closed on
Oct 27, 2011
Sold by
Gotter John S and Gotter Anna M
Bought by
Forke Kevin and Forke Sofia
Current Estimated Value
Home Financials for this Owner
Home Financials are based on the most recent Mortgage that was taken out on this home.
Original Mortgage
$160,000
Interest Rate
4.09%
Mortgage Type
New Conventional
Purchase Details
Closed on
May 22, 1998
Sold by
Fahey Daniel A and Haag Mary Jo
Bought by
Gotter John S and Gotter Anna M
Home Financials for this Owner
Home Financials are based on the most recent Mortgage that was taken out on this home.
Original Mortgage
$156,000
Interest Rate
7.27%
Purchase Details
Closed on
Jul 17, 1997
Sold by
Lahrman Richard P and Lahrman Carla J
Bought by
Fahey Daniel A and Haag Mary Jo
Home Financials for this Owner
Home Financials are based on the most recent Mortgage that was taken out on this home.
Original Mortgage
$170,200
Interest Rate
7.94%
Create a Home Valuation Report for This Property
The Home Valuation Report is an in-depth analysis detailing your home's value as well as a comparison with similar homes in the area
Home Values in the Area
Average Home Value in this Area
Purchase History
| Date | Buyer | Sale Price | Title Company |
|---|---|---|---|
| Forke Kevin | $200,000 | First American Title Ins Co | |
| Gotter John S | $176,000 | Greater Illinois Title Compa | |
| Fahey Daniel A | $175,500 | Golden Title |
Source: Public Records
Mortgage History
| Date | Status | Borrower | Loan Amount |
|---|---|---|---|
| Open | Forke Kevin | $202,467 | |
| Closed | Forke Kevin | $160,000 | |
| Previous Owner | Gotter John S | $10,000 | |
| Previous Owner | Gotter John S | $151,450 | |
| Previous Owner | Gotter John S | $156,000 | |
| Previous Owner | Fahey Daniel A | $170,200 |
Source: Public Records
Tax History Compared to Growth
Tax History
| Year | Tax Paid | Tax Assessment Tax Assessment Total Assessment is a certain percentage of the fair market value that is determined by local assessors to be the total taxable value of land and additions on the property. | Land | Improvement |
|---|---|---|---|---|
| 2023 | $9,209 | $118,009 | $19,358 | $98,651 |
| 2022 | $7,297 | $91,088 | $20,766 | $70,322 |
| 2021 | $6,997 | $84,859 | $19,346 | $65,513 |
| 2020 | $6,811 | $81,855 | $18,661 | $63,194 |
| 2019 | $6,643 | $78,345 | $17,861 | $60,484 |
| 2018 | $7,019 | $79,639 | $16,486 | $63,153 |
| 2017 | $6,874 | $75,025 | $15,531 | $59,494 |
| 2016 | $6,769 | $70,367 | $14,567 | $55,800 |
| 2013 | -- | $65,581 | $13,589 | $51,992 |
Source: Public Records
Map
Nearby Homes
- 621 Hackberry Ln
- 1650 Cumberland Pkwy
- 610 Old Oak Cir
- 530 Old Oak Cir
- Lot 1-6 Starr Dr
- 1211 Prairie Dr
- 8 Oxford Ct Unit 1
- 450 Old Oak Cir
- 11365 Haegers Bend Rd
- 931 Old Oak Cir
- 1241 Big Sur Pkwy
- 2041 Tahoe Pkwy
- 1188 E Algonquin Rd
- 2210 Periwinkle Ln
- Lot 4 b Ryan Pkwy
- 1782 Cumberland Pkwy
- 1539 Lowe Dr
- 2 Cumberland Pkwy
- 10613 Haegers Bend Rd
- 1527 N Harrison St
- 655 Fox Run Ln
- 635 Fox Run Ln
- 675 Fox Run Ln
- 640 Claymont Ct
- 660 Claymont Ct
- 695 Fox Run Ln
- 1625 Powder Horn Dr
- 1605 Powder Horn Dr
- 680 Claymont Ct
- 715 Fox Run Ln
- 660 Fox Run Ln
- 1575 Powder Horn Dr
- 680 Fox Run Ln
- 640 Fox Run Ln
- 620 Fox Run Ln
- 600 Fox Run Ln
- 735 Fox Run Ln
- 710 Claymont Ct
- 1690 Cedarwood Ln
- 710 Fox Run Ln