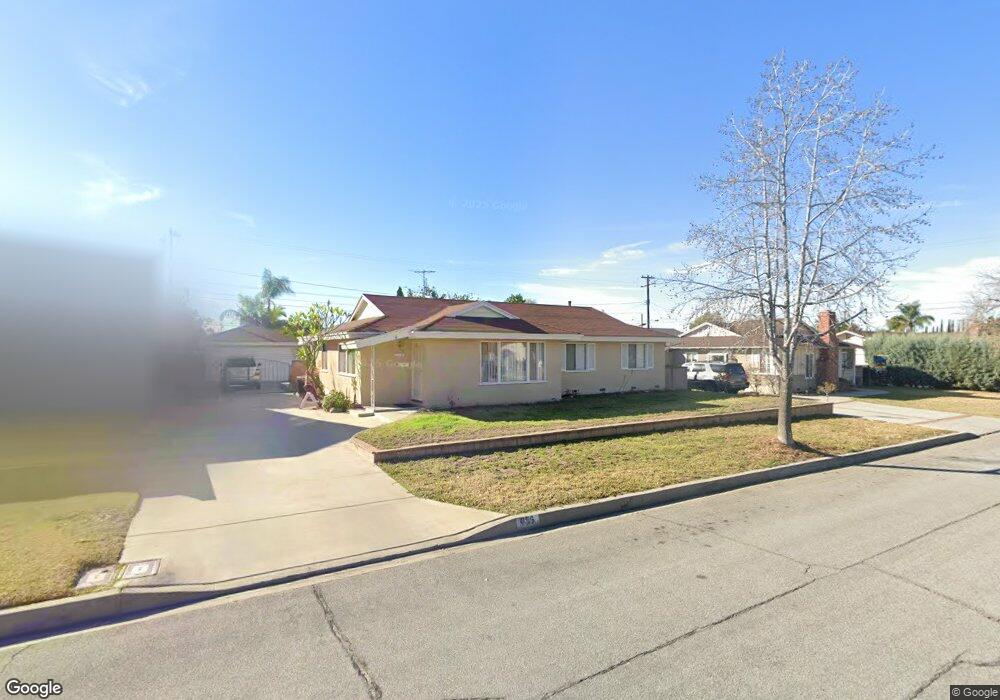
656 E Renwick Rd Glendora, CA 91740
Charter oak NeighborhoodEstimated Value: $807,261 - $877,000
4
Beds
2
Baths
1,457
Sq Ft
$582/Sq Ft
Est. Value
About This Home
This home is located at 656 E Renwick Rd, Glendora, CA 91740 and is currently estimated at $848,065, approximately $582 per square foot. 656 E Renwick Rd is a home located in Los Angeles County with nearby schools including Willow Elementary School, Royal Oak Middle School, and Charter Oak High School.
Ownership History
Date
Name
Owned For
Owner Type
Purchase Details
Closed on
Sep 19, 2018
Sold by
Crosby Vanessa
Bought by
Crosby Vanessa and The Vanessa Crosby Living Trus
Current Estimated Value
Purchase Details
Closed on
Jul 29, 2002
Sold by
Crosby Donald Alan
Bought by
Crosby Vanessa
Home Financials for this Owner
Home Financials are based on the most recent Mortgage that was taken out on this home.
Original Mortgage
$209,500
Outstanding Balance
$87,613
Interest Rate
6.52%
Estimated Equity
$760,452
Purchase Details
Closed on
Jul 22, 2002
Sold by
Summers Kathryn A
Bought by
Crosby Vanessa
Home Financials for this Owner
Home Financials are based on the most recent Mortgage that was taken out on this home.
Original Mortgage
$209,500
Outstanding Balance
$87,613
Interest Rate
6.52%
Estimated Equity
$760,452
Purchase Details
Closed on
Aug 7, 1998
Sold by
Lewis Robert W
Bought by
Summers Kathryn A and Robert Wm Lewis Revocable Living Trust
Create a Home Valuation Report for This Property
The Home Valuation Report is an in-depth analysis detailing your home's value as well as a comparison with similar homes in the area
Home Values in the Area
Average Home Value in this Area
Purchase History
| Date | Buyer | Sale Price | Title Company |
|---|---|---|---|
| Crosby Vanessa | -- | None Available | |
| Crosby Vanessa | -- | Orange Coast Title | |
| Crosby Vanessa | $279,500 | Orange Coast Title | |
| Summers Kathryn A | -- | -- |
Source: Public Records
Mortgage History
| Date | Status | Borrower | Loan Amount |
|---|---|---|---|
| Open | Crosby Vanessa | $209,500 |
Source: Public Records
Tax History
| Year | Tax Paid | Tax Assessment Tax Assessment Total Assessment is a certain percentage of the fair market value that is determined by local assessors to be the total taxable value of land and additions on the property. | Land | Improvement |
|---|---|---|---|---|
| 2025 | $4,954 | $404,784 | $260,831 | $143,953 |
| 2024 | $4,954 | $396,848 | $255,717 | $141,131 |
| 2023 | $4,835 | $389,067 | $250,703 | $138,364 |
| 2022 | $4,773 | $381,439 | $245,788 | $135,651 |
| 2021 | $4,700 | $373,961 | $240,969 | $132,992 |
| 2019 | $4,596 | $362,872 | $233,823 | $129,049 |
| 2018 | $4,348 | $355,758 | $229,239 | $126,519 |
| 2016 | $4,151 | $341,946 | $220,339 | $121,607 |
| 2015 | $4,133 | $336,811 | $217,030 | $119,781 |
| 2014 | $4,127 | $330,214 | $212,779 | $117,435 |
Source: Public Records
Map
Nearby Homes
- 905 E Juanita Ave
- 520 Claraday St Unit 1
- 5141 N Lyman Ave
- 20821 E Calora St Unit E1
- 20805 E Calora St Unit G2
- 20821 E Calora St Unit E6
- 1032 E Juanita Ave
- 1389 N Sunflower Ave
- 1226 Wales Ave
- 1387 N Sunflower Ave
- 5035 N Greer Ave
- 315 E Juanita Ave
- 907 Shady Ln
- 625 -627 S Wabash Ave
- 2003 E Cienega Ave
- 20290 E Arrow Hwy Unit C
- 20232 E Arrow Hwy
- 201 E Arrow Hwy Unit 64
- 201 E Arrow Hwy Unit 70
- 201 E Arrow Hwy Unit 73
- 660 E Renwick Rd
- 648 E Renwick Rd
- 657 E Juanita Ave
- 661 E Juanita Ave
- 649 E Juanita Ave
- 704 E Renwick Rd
- 642 E Renwick Rd
- 657 E Renwick Rd
- 649 E Renwick Rd
- 661 E Renwick Rd
- 705 E Juanita Ave
- 643 E Juanita Ave
- 705 E Renwick Rd
- 643 E Renwick Rd
- 716 E Renwick Rd
- 717 E Juanita Ave
- 656 E Kirkwall Rd
- 658 E Juanita Ave
- 656 E Juanita Ave
- 441 E Juanita Ave
Your Personal Tour Guide
Ask me questions while you tour the home.