Estimated Value: $616,803 - $702,000
4
Beds
3
Baths
2,504
Sq Ft
$265/Sq Ft
Est. Value
About This Home
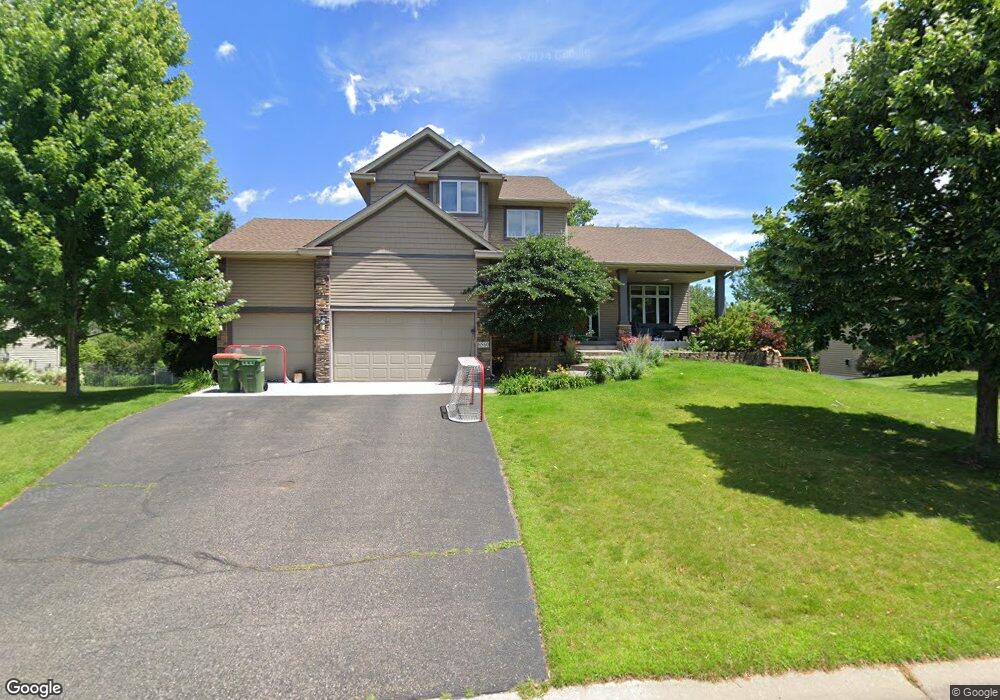
This home is located at 6560 Pheasant Hills Dr, Hugo, MN 55038 and is currently estimated at $662,701, approximately $264 per square foot. 6560 Pheasant Hills Dr is a home located in Anoka County with nearby schools including Centerville Elementary School, Centennial Middle School, and Centennial High School.
Ownership History
Date
Name
Owned For
Owner Type
Purchase Details
Closed on
May 27, 2016
Sold by
Mcmanus John and Mcmanus Alyssa
Bought by
Sandnas Jeremy M and Sandnas Annie E
Current Estimated Value
Home Financials for this Owner
Home Financials are based on the most recent Mortgage that was taken out on this home.
Original Mortgage
$341,520
Outstanding Balance
$271,989
Interest Rate
3.59%
Mortgage Type
New Conventional
Estimated Equity
$390,712
Purchase Details
Closed on
Sep 21, 2006
Sold by
Chenan Construction Inc
Bought by
Mcmanus John and Mcmanus Alyssa
Home Financials for this Owner
Home Financials are based on the most recent Mortgage that was taken out on this home.
Original Mortgage
$363,920
Interest Rate
6.49%
Mortgage Type
New Conventional
Create a Home Valuation Report for This Property
The Home Valuation Report is an in-depth analysis detailing your home's value as well as a comparison with similar homes in the area
Home Values in the Area
Average Home Value in this Area
Purchase History
| Date | Buyer | Sale Price | Title Company |
|---|---|---|---|
| Sandnas Jeremy M | $426,900 | Titlesmart Inc | |
| Mcmanus John | $454,900 | -- |
Source: Public Records
Mortgage History
| Date | Status | Borrower | Loan Amount |
|---|---|---|---|
| Open | Sandnas Jeremy M | $341,520 | |
| Previous Owner | Mcmanus John | $363,920 |
Source: Public Records
Tax History Compared to Growth
Tax History
| Year | Tax Paid | Tax Assessment Tax Assessment Total Assessment is a certain percentage of the fair market value that is determined by local assessors to be the total taxable value of land and additions on the property. | Land | Improvement |
|---|---|---|---|---|
| 2025 | $7,328 | $596,600 | $132,000 | $464,600 |
| 2024 | $7,328 | $592,700 | $125,600 | $467,100 |
| 2023 | $6,599 | $586,600 | $128,900 | $457,700 |
| 2022 | $6,234 | $580,200 | $116,200 | $464,000 |
| 2021 | $6,301 | $482,100 | $89,100 | $393,000 |
| 2020 | $6,295 | $473,900 | $99,000 | $374,900 |
| 2019 | $6,156 | $455,200 | $95,600 | $359,600 |
| 2018 | $5,629 | $420,300 | $0 | $0 |
| 2017 | $5,395 | $418,500 | $0 | $0 |
| 2016 | $5,585 | $381,500 | $0 | $0 |
| 2015 | $5,187 | $381,500 | $103,100 | $278,400 |
| 2014 | -- | $326,200 | $100,700 | $225,500 |
Source: Public Records
Map
Nearby Homes
- 1469 Sherman Lake Rd
- 1428 Sherman Lake Rd
- 1425 Holly Dr E
- 1554 Holly Dr E
- 1367 Wolf Cir
- 1610 Widgeon Cir
- 6733 Timberwolf Trail
- 1707 Dupre Rd
- 1159 Durango Point
- 6868 Dupre Rd
- 6408 Cassiopeia Ct
- 6961 Meadow Ct
- 1988 Norma Way
- 6542 Black Duck Dr S
- 61xx 20th Ave NE
- 7037 Lamotte Dr
- 1080 Killdeer Ct
- 7057 Dupre Rd
- 6478 Fox Rd
- 6246 Otter Lake Rd
- 6560 Pheasant
- 6580 Pheasant Hills Dr
- 6590 Pheasant Hills Dr
- 6550 Pheasant Hills Dr
- 6570 Pheasant Hills Dr
- 6565 Pheasant Hills Dr
- 6540 Pheasant Hills Dr
- 6575 Pheasant Hills Dr
- 6555 Pheasant Hills Dr
- 6530 Pheasant Hills Dr
- 6585 Pheasant Hills Dr
- 6577 Sherman Lake Rd
- 6587 Sherman Lake Rd
- 6545 Pheasant Hills Dr
- 6597 Sherman Lake Rd
- 6567 Sherman Lake Rd
- 659x Sherman Lake Rd
- 6557 Sherman Lake Rd
- 6586 Sherman Lake Rd
- 1540 Sedge Ct