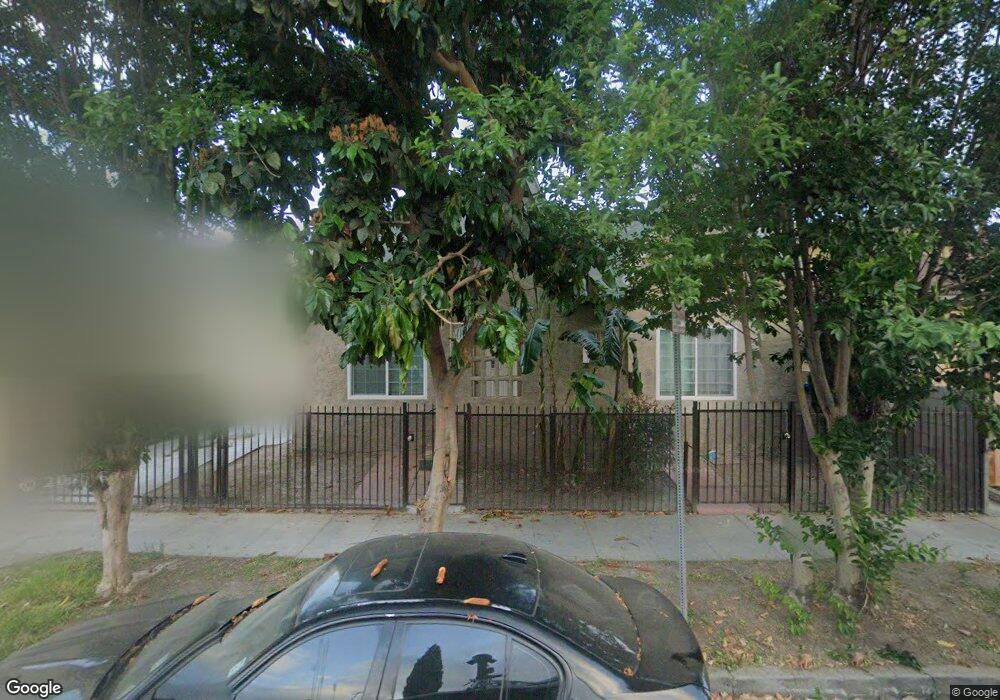
6567 S Van Ness Ave Unit A Los Angeles, CA 90047
Hyde Park NeighborhoodEstimated Value: $639,000 - $840,000
6
Beds
2
Baths
2,062
Sq Ft
$371/Sq Ft
Est. Value
About This Home
This home is located at 6567 S Van Ness Ave Unit A, Los Angeles, CA 90047 and is currently estimated at $764,413, approximately $370 per square foot. 6567 S Van Ness Ave Unit A is a home located in Los Angeles County with nearby schools including Horace Mann Ucla Community, Fifty-Ninth Street Elementary School, and Crenshaw Science, Technology, Engineering, Math And Medicine Magnet.
Ownership History
Date
Name
Owned For
Owner Type
Purchase Details
Closed on
Jan 13, 2017
Sold by
Neydavood Mitra
Bought by
Dmj Investment Group Llc
Current Estimated Value
Home Financials for this Owner
Home Financials are based on the most recent Mortgage that was taken out on this home.
Original Mortgage
$370,000
Interest Rate
3.57%
Mortgage Type
New Conventional
Purchase Details
Closed on
Dec 20, 2016
Sold by
Dmj Investment Group Llc
Bought by
Neydavood Mitra
Home Financials for this Owner
Home Financials are based on the most recent Mortgage that was taken out on this home.
Original Mortgage
$370,000
Interest Rate
3.57%
Mortgage Type
New Conventional
Purchase Details
Closed on
Mar 17, 2016
Sold by
Neydavood Mitra
Bought by
Dmj Investment Group Llc
Purchase Details
Closed on
Jul 6, 2015
Sold by
Figueroa Dora Alicia and Rodriguez Zepeda Dora Alicia
Bought by
Neydavood Mitra
Home Financials for this Owner
Home Financials are based on the most recent Mortgage that was taken out on this home.
Original Mortgage
$233,493
Interest Rate
3.98%
Mortgage Type
New Conventional
Purchase Details
Closed on
Apr 19, 2005
Sold by
Figueroa Jeronimo
Bought by
Figueroa Dora Alicia
Purchase Details
Closed on
Mar 5, 2004
Sold by
Hud
Bought by
Figueroa Jeronimo
Home Financials for this Owner
Home Financials are based on the most recent Mortgage that was taken out on this home.
Original Mortgage
$300,000
Interest Rate
7.99%
Mortgage Type
Purchase Money Mortgage
Purchase Details
Closed on
Jul 22, 2002
Sold by
Crosby Samuel
Bought by
First Nationwide Mtg Corp
Purchase Details
Closed on
Jul 18, 2002
Sold by
First Nationwide Mortgage Corp
Bought by
Hud
Purchase Details
Closed on
Aug 23, 2001
Sold by
Redeemer Ondeya
Bought by
Crosby Samuel
Home Financials for this Owner
Home Financials are based on the most recent Mortgage that was taken out on this home.
Original Mortgage
$226,446
Interest Rate
7.09%
Mortgage Type
FHA
Purchase Details
Closed on
Jun 4, 1999
Sold by
Terry Earley J and Terry Beverlyn
Bought by
Redeemer Ondeya
Home Financials for this Owner
Home Financials are based on the most recent Mortgage that was taken out on this home.
Original Mortgage
$140,000
Interest Rate
7.01%
Create a Home Valuation Report for This Property
The Home Valuation Report is an in-depth analysis detailing your home's value as well as a comparison with similar homes in the area
Home Values in the Area
Average Home Value in this Area
Purchase History
| Date | Buyer | Sale Price | Title Company |
|---|---|---|---|
| Dmj Investment Group Llc | -- | None Available | |
| Neydavood Mitra | -- | Title 365 Company | |
| Dmj Investment Group Llc | -- | None Available | |
| Neydavood Mitra | $311,500 | None Available | |
| Figueroa Dora Alicia | -- | -- | |
| Figueroa Jeronimo | $300,000 | Nations Title Co | |
| First Nationwide Mtg Corp | $244,043 | Fidelity National Title | |
| Hud | -- | Fidelity National Title | |
| Crosby Samuel | $230,000 | Investors Title Company | |
| Redeemer Ondeya | $140,000 | Commonwealth Title |
Source: Public Records
Mortgage History
| Date | Status | Borrower | Loan Amount |
|---|---|---|---|
| Previous Owner | Neydavood Mitra | $370,000 | |
| Previous Owner | Neydavood Mitra | $233,493 | |
| Previous Owner | Figueroa Jeronimo | $300,000 | |
| Previous Owner | Crosby Samuel | $226,446 | |
| Previous Owner | Redeemer Ondeya | $140,000 |
Source: Public Records
Tax History Compared to Growth
Tax History
| Year | Tax Paid | Tax Assessment Tax Assessment Total Assessment is a certain percentage of the fair market value that is determined by local assessors to be the total taxable value of land and additions on the property. | Land | Improvement |
|---|---|---|---|---|
| 2025 | $4,887 | $384,761 | $250,368 | $134,393 |
| 2024 | $4,887 | $377,217 | $245,459 | $131,758 |
| 2023 | $4,801 | $369,822 | $240,647 | $129,175 |
| 2022 | $4,590 | $362,572 | $235,929 | $126,643 |
| 2021 | $4,523 | $355,463 | $231,303 | $124,160 |
| 2019 | $4,393 | $344,922 | $224,444 | $120,478 |
| 2018 | $4,298 | $338,160 | $220,044 | $118,116 |
| 2016 | $3,936 | $311,500 | $211,500 | $100,000 |
| 2015 | $6,444 | $521,905 | $405,929 | $115,976 |
| 2014 | $6,476 | $511,683 | $397,978 | $113,705 |
Source: Public Records
Map
Nearby Homes
- 6820 S Van Ness Ave
- 6428 S Van Ness Ave
- 2035 W 68th St
- 6418 3rd Ave
- 7037 Cimarron St
- 6567 5th Ave
- 2027 W 70th St
- 2049 W 71st St
- 6239 Cimarron St
- 2000 W 68th St
- 7029 4th Ave
- 2037 W 64th St
- 2615 Southwest Dr
- 2114 W Florence Ave
- 2228 W 73rd St
- 7036 6th Ave
- 6327 5th Ave
- 6727 7th Ave
- 2407 W 74th St
- 6325 6th Ave
- 6565 S Van Ness Ave Unit A
- 6569 S Van Ness Ave
- 6559 S Van Ness Ave
- 6601 S Van Ness Ave
- 6555 S Van Ness Ave
- 6568 S Van Ness Ave
- 6568 S Van Ness Ave
- 6566 S Van Ness Ave
- 6572 S Van Ness Ave
- 6568 Arlington Ave
- 6562 S Van Ness Ave
- 6564 Arlington Ave
- 6572 Arlington Ave
- 2200 W 65th Place
- 6582 S Van Ness Ave
- 6578 S Van Ness Ave
- 6558 S Van Ness Ave
- 6558 S Van Ness Ave
- 6560 Arlington Ave
- 6576 Arlington Ave