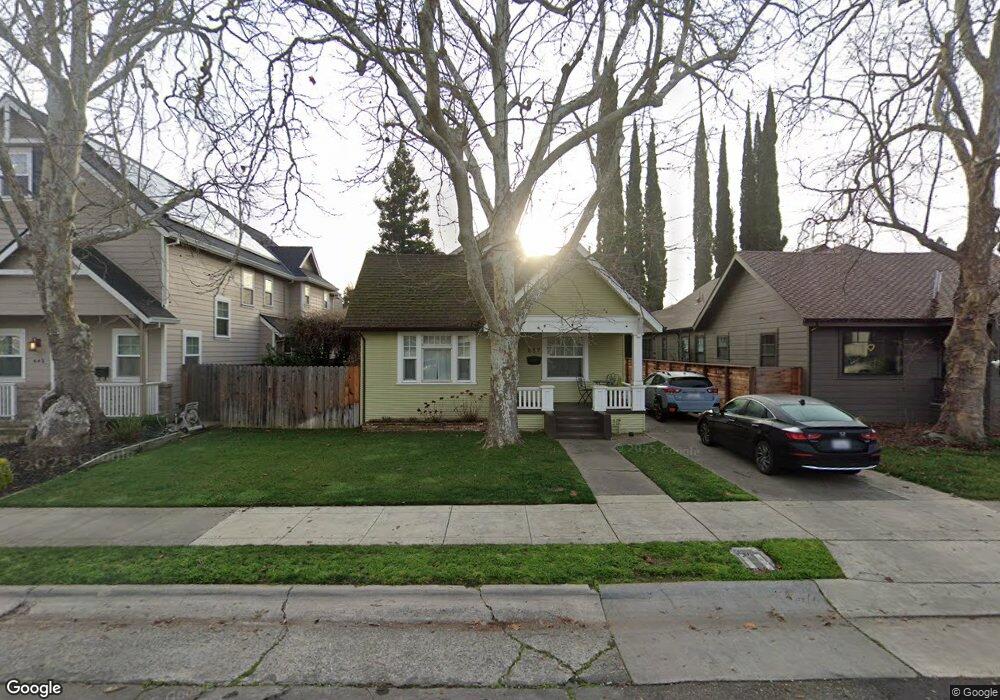
657 41st St Sacramento, CA 95819
East Sacramento NeighborhoodEstimated Value: $687,000 - $739,967
3
Beds
1
Bath
1,219
Sq Ft
$577/Sq Ft
Est. Value
About This Home
This home is located at 657 41st St, Sacramento, CA 95819 and is currently estimated at $703,492, approximately $577 per square foot. 657 41st St is a home located in Sacramento County with nearby schools including Theodore Judah Elementary, Miwok Middle School, and Hiram W. Johnson High School.
Ownership History
Date
Name
Owned For
Owner Type
Purchase Details
Closed on
Jan 11, 2012
Sold by
Hastings Darren C and Hastings Yvette H
Bought by
Hastings Darren and Hastings Yvette
Current Estimated Value
Home Financials for this Owner
Home Financials are based on the most recent Mortgage that was taken out on this home.
Original Mortgage
$354,724
Outstanding Balance
$242,606
Interest Rate
3.93%
Mortgage Type
New Conventional
Estimated Equity
$460,886
Purchase Details
Closed on
Jul 2, 2008
Sold by
Kampmeinert Albert F H and Estate Of Hedwig Kampmeinert
Bought by
Hastings Darren C and Magallanes Yvette H
Home Financials for this Owner
Home Financials are based on the most recent Mortgage that was taken out on this home.
Original Mortgage
$250,750
Interest Rate
6.04%
Mortgage Type
Purchase Money Mortgage
Create a Home Valuation Report for This Property
The Home Valuation Report is an in-depth analysis detailing your home's value as well as a comparison with similar homes in the area
Home Values in the Area
Average Home Value in this Area
Purchase History
| Date | Buyer | Sale Price | Title Company |
|---|---|---|---|
| Hastings Darren | -- | Stewart Title Of Sacramento | |
| Hastings Darren C | $295,000 | Financial Title Company |
Source: Public Records
Mortgage History
| Date | Status | Borrower | Loan Amount |
|---|---|---|---|
| Open | Hastings Darren | $354,724 | |
| Closed | Hastings Darren C | $250,750 |
Source: Public Records
Tax History Compared to Growth
Tax History
| Year | Tax Paid | Tax Assessment Tax Assessment Total Assessment is a certain percentage of the fair market value that is determined by local assessors to be the total taxable value of land and additions on the property. | Land | Improvement |
|---|---|---|---|---|
| 2025 | $4,893 | $412,067 | $283,300 | $128,767 |
| 2024 | $4,893 | $403,989 | $277,746 | $126,243 |
| 2023 | $4,778 | $396,068 | $272,300 | $123,768 |
| 2022 | $4,698 | $388,303 | $266,961 | $121,342 |
| 2021 | $4,476 | $380,690 | $261,727 | $118,963 |
| 2020 | $4,513 | $376,788 | $259,044 | $117,744 |
| 2019 | $4,418 | $369,401 | $253,965 | $115,436 |
| 2018 | $4,304 | $362,159 | $248,986 | $113,173 |
| 2017 | $4,244 | $355,058 | $244,104 | $110,954 |
| 2016 | $4,158 | $348,097 | $239,318 | $108,779 |
| 2015 | $4,093 | $342,870 | $235,724 | $107,146 |
| 2014 | $3,982 | $336,155 | $231,107 | $105,048 |
Source: Public Records
Map
Nearby Homes