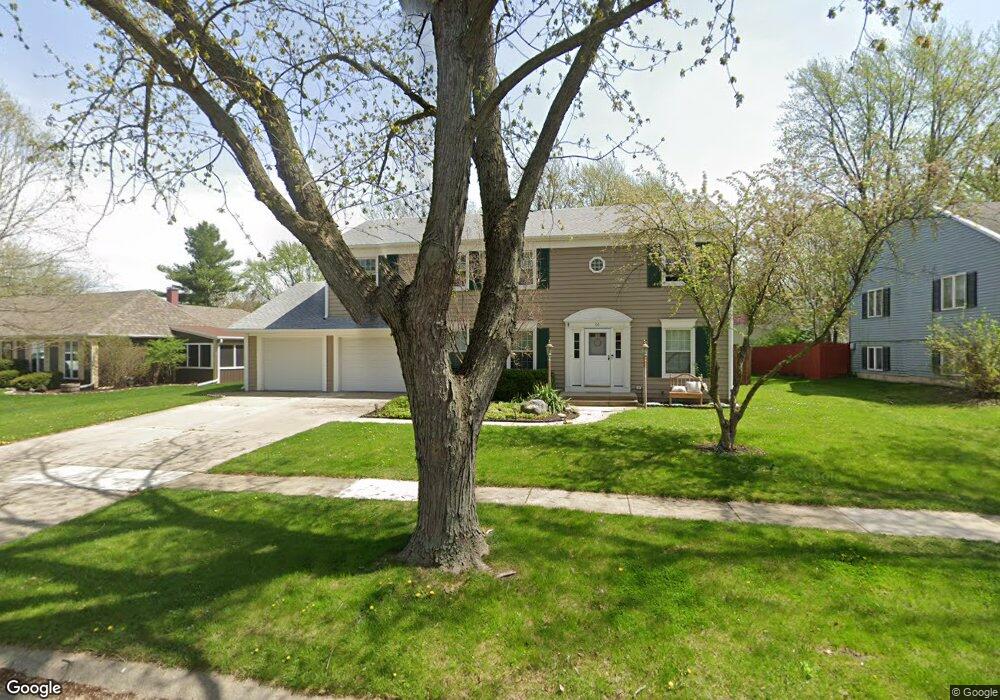
66 Brock Way Oswego, IL 60543
Boulder Hill NeighborhoodEstimated Value: $390,553 - $429,000
4
Beds
3
Baths
2,200
Sq Ft
$185/Sq Ft
Est. Value
About This Home
This home is located at 66 Brock Way, Oswego, IL 60543 and is currently estimated at $406,388, approximately $184 per square foot. 66 Brock Way is a home located in Kendall County with nearby schools including Old Post Elementary School, Thompson Jr. High School, and Oswego High School.
Ownership History
Date
Name
Owned For
Owner Type
Purchase Details
Closed on
Dec 21, 2021
Sold by
Parker Joshua T and Parker Catherine E
Bought by
Diederichs Sean and Weaver Jacqulyn
Current Estimated Value
Home Financials for this Owner
Home Financials are based on the most recent Mortgage that was taken out on this home.
Original Mortgage
$239,200
Outstanding Balance
$220,031
Interest Rate
3.12%
Mortgage Type
New Conventional
Estimated Equity
$186,357
Purchase Details
Closed on
Mar 3, 2020
Sold by
Samburg Jeffrey and Samburg Kelly
Bought by
Parker Joshua T and Parker Catherine E
Home Financials for this Owner
Home Financials are based on the most recent Mortgage that was taken out on this home.
Original Mortgage
$251,750
Interest Rate
3.87%
Mortgage Type
New Conventional
Purchase Details
Closed on
Jan 21, 2014
Sold by
Federal Home Loan Mortgage Corporation
Bought by
Samburg Jeffrey and Samburg Kelly
Home Financials for this Owner
Home Financials are based on the most recent Mortgage that was taken out on this home.
Original Mortgage
$196,128
Interest Rate
4.45%
Mortgage Type
FHA
Purchase Details
Closed on
Jan 1, 2014
Bought by
Samburg Jeffrey and Samburg Kelly
Home Financials for this Owner
Home Financials are based on the most recent Mortgage that was taken out on this home.
Original Mortgage
$196,128
Interest Rate
4.45%
Mortgage Type
FHA
Purchase Details
Closed on
Apr 22, 2013
Sold by
Williams Michael J
Bought by
Federal Home Loan Mortgage Corporation
Purchase Details
Closed on
Nov 20, 2007
Sold by
Hanson Kevin R and Hanson Robin M
Bought by
Williams Michael J and Williams Jennifer M
Home Financials for this Owner
Home Financials are based on the most recent Mortgage that was taken out on this home.
Original Mortgage
$247,950
Interest Rate
6.3%
Mortgage Type
Purchase Money Mortgage
Purchase Details
Closed on
Feb 14, 2003
Sold by
Lundin Steven J and Lundin Laurie A
Bought by
Hanson Kevin R and Hanson Robin M
Home Financials for this Owner
Home Financials are based on the most recent Mortgage that was taken out on this home.
Original Mortgage
$231,647
Interest Rate
5.87%
Mortgage Type
VA
Purchase Details
Closed on
Jan 15, 1998
Sold by
Roverud Gary P and Roverud Joan S
Bought by
Lundin Steven J and Lundin Laurie A
Home Financials for this Owner
Home Financials are based on the most recent Mortgage that was taken out on this home.
Original Mortgage
$105,600
Interest Rate
7.24%
Create a Home Valuation Report for This Property
The Home Valuation Report is an in-depth analysis detailing your home's value as well as a comparison with similar homes in the area
Home Values in the Area
Average Home Value in this Area
Purchase History
| Date | Buyer | Sale Price | Title Company |
|---|---|---|---|
| Diederichs Sean | $299,000 | Chicago Title | |
| Parker Joshua T | $265,000 | Stewart Title | |
| Samburg Jeffrey | $200,500 | Attorneys Title Guaranty Fun | |
| Samburg Jeffrey | $200,100 | -- | |
| Federal Home Loan Mortgage Corporation | -- | None Available | |
| Williams Michael J | $261,000 | Greater Illinois Title Compa | |
| Hanson Kevin R | $225,000 | First American Title Ins Co | |
| Lundin Steven J | $132,000 | -- |
Source: Public Records
Mortgage History
| Date | Status | Borrower | Loan Amount |
|---|---|---|---|
| Open | Diederichs Sean | $239,200 | |
| Previous Owner | Parker Joshua T | $251,750 | |
| Previous Owner | Samburg Jeffrey | $196,128 | |
| Previous Owner | Williams Michael J | $247,950 | |
| Previous Owner | Hanson Kevin R | $231,647 | |
| Previous Owner | Lundin Steven J | $105,600 | |
| Closed | Samburg Jeffrey | -- |
Source: Public Records
Tax History Compared to Growth
Tax History
| Year | Tax Paid | Tax Assessment Tax Assessment Total Assessment is a certain percentage of the fair market value that is determined by local assessors to be the total taxable value of land and additions on the property. | Land | Improvement |
|---|---|---|---|---|
| 2024 | $8,281 | $108,904 | $21,511 | $87,393 |
| 2023 | $8,381 | $105,732 | $20,884 | $84,848 |
| 2022 | $8,381 | $98,815 | $19,518 | $79,297 |
| 2021 | $8,079 | $92,350 | $18,241 | $74,109 |
| 2020 | $7,824 | $88,798 | $17,539 | $71,259 |
| 2019 | $7,622 | $85,405 | $17,539 | $67,866 |
| 2018 | $6,969 | $77,931 | $16,004 | $61,927 |
| 2017 | $6,748 | $71,826 | $14,750 | $57,076 |
| 2016 | $3,115 | $65,895 | $13,532 | $52,363 |
| 2015 | $6,001 | $61,014 | $12,530 | $48,484 |
| 2014 | -- | $58,667 | $12,048 | $46,619 |
| 2013 | -- | $61,755 | $12,682 | $49,073 |
Source: Public Records
Map
Nearby Homes
- 22 Sherwick Rd
- 38 Ashlawn Ave
- 9 Cebold Dr
- 4 Circle Ct
- 10 Crofton Rd
- 40 Codorus Rd
- 47 Old Post Rd
- 3 Orchard Rd
- 123 Orchard Rd
- 2 Orchard Rd
- 141 River Mist Dr
- 156 River Mist Dr
- 39 Cayman Dr
- 1415 State Route 31
- 2110 State Route 31
- 420 Chesterfield Ct Unit 420
- 3 Scarsdale Rd
- 2300 Light Rd Unit 209
- 7.43 Acres Vacant La State Route 31
- 119 Garden Dr