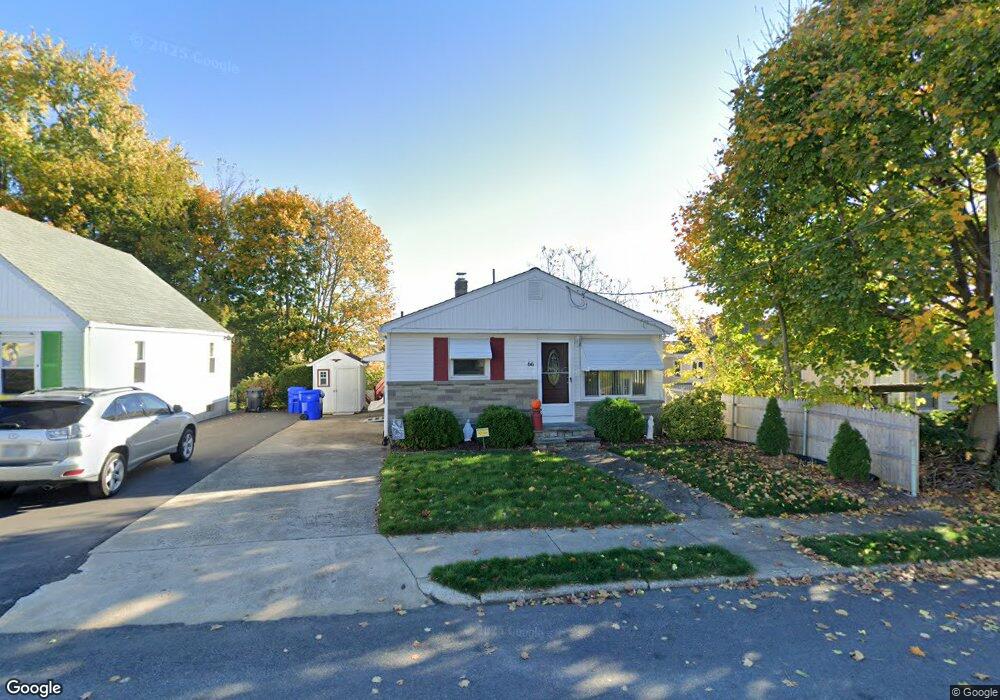
66 Fillmore St Pawtucket, RI 02860
Fairlawn NeighborhoodEstimated Value: $378,595 - $447,000
2
Beds
2
Baths
960
Sq Ft
$425/Sq Ft
Est. Value
About This Home
This home is located at 66 Fillmore St, Pawtucket, RI 02860 and is currently estimated at $407,899, approximately $424 per square foot. 66 Fillmore St is a home located in Providence County with nearby schools including Blackstone Valley Prep Upper Elementary School, The San Miguel School, and Bishop Keough Regional High School.
Ownership History
Date
Name
Owned For
Owner Type
Purchase Details
Closed on
Feb 4, 2020
Sold by
Caldarone Andrew T
Bought by
Caldarone Ft
Current Estimated Value
Purchase Details
Closed on
Nov 22, 2019
Sold by
Caldarone Corinne L
Bought by
Caldarone Ft and Caldarone
Purchase Details
Closed on
Oct 30, 2019
Sold by
Caldarone Andrew I and Caldarone Corinne L
Bought by
Caldarone Corinne L
Purchase Details
Closed on
Jul 1, 2019
Sold by
Caldarone Corinne L
Bought by
Caldarone Ft and Caldarone
Create a Home Valuation Report for This Property
The Home Valuation Report is an in-depth analysis detailing your home's value as well as a comparison with similar homes in the area
Home Values in the Area
Average Home Value in this Area
Purchase History
| Date | Buyer | Sale Price | Title Company |
|---|---|---|---|
| Caldarone Ft | -- | None Available | |
| Caldarone Ft | -- | None Available | |
| Caldarone Ft | -- | -- | |
| Caldarone Corinne L | -- | -- | |
| Caldarone Ft | -- | -- | |
| Caldarone Ft | -- | -- | |
| Caldarone Andrew T | -- | -- |
Source: Public Records
Tax History Compared to Growth
Tax History
| Year | Tax Paid | Tax Assessment Tax Assessment Total Assessment is a certain percentage of the fair market value that is determined by local assessors to be the total taxable value of land and additions on the property. | Land | Improvement |
|---|---|---|---|---|
| 2025 | $4,165 | $316,700 | $132,400 | $184,300 |
| 2024 | $3,908 | $316,700 | $132,400 | $184,300 |
| 2023 | $3,779 | $223,100 | $68,000 | $155,100 |
| 2022 | $3,699 | $223,100 | $68,000 | $155,100 |
| 2021 | $3,699 | $223,100 | $68,000 | $155,100 |
| 2020 | $3,754 | $179,700 | $65,400 | $114,300 |
| 2019 | $3,754 | $179,700 | $65,400 | $114,300 |
| 2018 | $3,617 | $179,700 | $65,400 | $114,300 |
| 2017 | $3,360 | $147,900 | $49,900 | $98,000 |
| 2016 | $3,238 | $147,900 | $49,900 | $98,000 |
| 2015 | $3,238 | $147,900 | $49,900 | $98,000 |
| 2014 | $3,496 | $151,600 | $55,400 | $96,200 |
Source: Public Records
Map
Nearby Homes